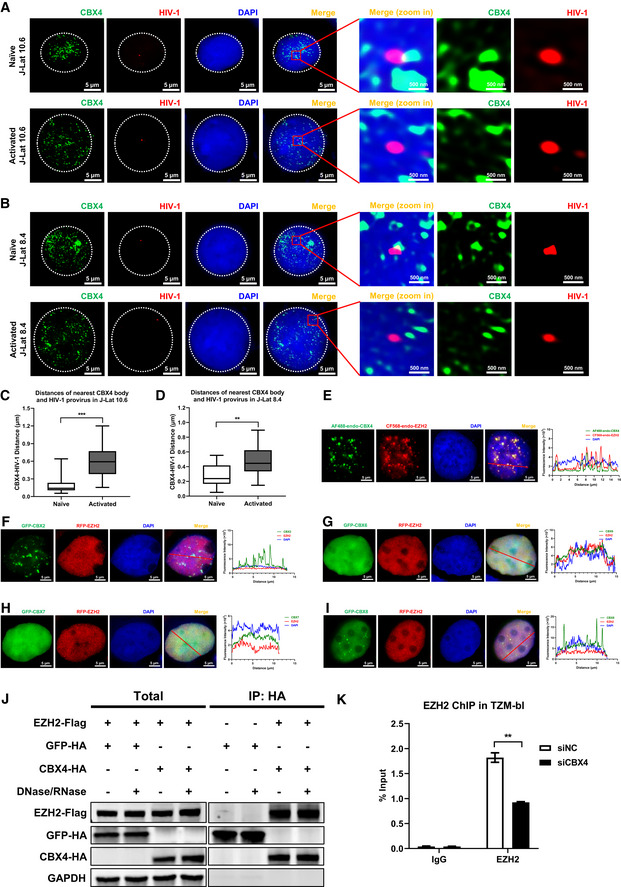
Figure EV2. CBX4 bodies colocalize with latent HIV‐1 proviruses and EZH2.

-
A, BImmunoFISH images of the pseudotyped HIV‐1 genomic DNA and CBX4 bodies in J‐Lat 10.6 and 8.4. Naïve cells were treated with DMSO. Activated cells were treated with TNFα. The right images show amplified regions.
-
C, DDistances of the nearest CBX4 body and the HIV‐1 provirus in both naïve and activated cells were measured with Imaris software. In each group, 15 cells were randomly imaged and measured the CBX4‐HIV‐1 distances. The quantification of distances was evaluated in both J‐Lat 10.6 (C) and 8.4 (D) cells.
-
EThe endogenous CBX4 and EZH2 in HEK293T cells were captured with rabbit anti‐CBX4 antibody and mouse anti‐EZH2 antibody respectively. These cells were further incubated with AF488‐conjugated anti‐rabbit IgG antibody and CF568‐conjugated anti‐mouse IgG antibody. DAPI indicated DNA. The co‐localization was evaluated by line scan profile and shown on the right. The red arrow indicates the profiled position.
-
F–IGFP‐tagged CBX2, CBX6, CBX7 and CBX8 were co‐overexpressed with RFP‐tagged EZH2. SIM imaging was performed for each combination. Line scan profiles are shown on the right of each panel. Red arrows in merged images indicate the positions where line scans are profiled.
-
JHA‐tagged CBX4 and GFP were co‐overexpressed with Flag‐tagged EZH2. HA‐tagged proteins were immunoprecipitated (IP) with anti‐HA beads. In both groups, the IP reactions were supplemented with DNase/RNase or left untreated. Both total and IP samples were immunoblotted (IB) with anti‐HA and anti‐Flag antibodies.
-
KChIP assays with antibodies against IgG and EZH2 were performed in siNC and siCBX4 TZM‐bl cells.
Data information: Scale bars in (A), (B) and (E–I) represent 5 μm. Scale bars in amplified images within (A) and (B) represent 500 nm. All the samples were imaged to obtain at least three sets of images. Data in (C) and (D) represent distances in biological replicates (n = 15 for C and D). The central bands of the boxplots represent median values of distances. The heights of the boxes represent the interquartile ranges of distances. The boundaries of the upper whiskers and the lower whiskers represent the maximum distances and the minimum distances, respectively. Data in (K) are presented as mean ± SEM in biological triplicate. P‐values in (C), (D) and (K) were calculated by Student's t‐test. **P < 0.01, ***P < 0.001.
