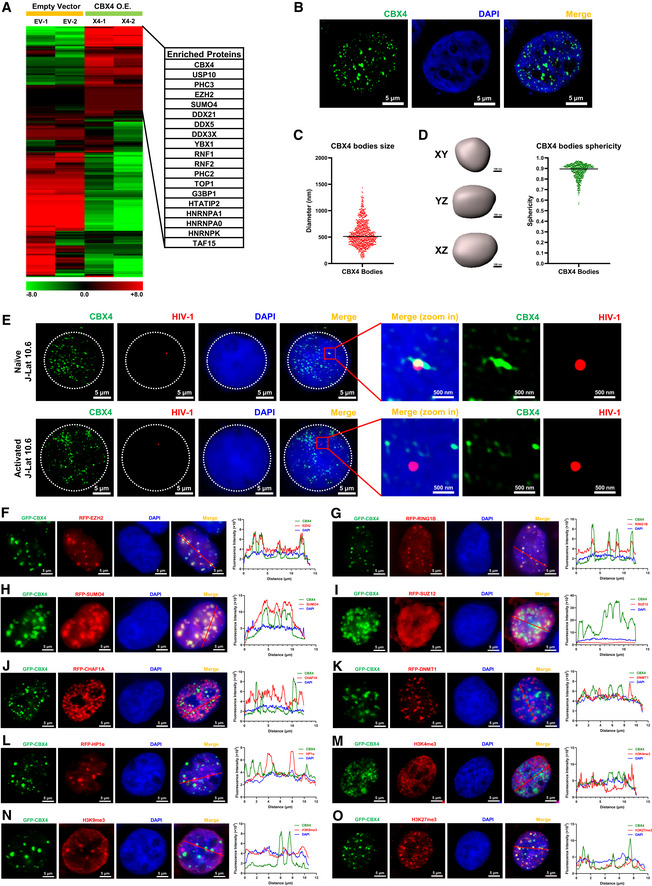
Figure 3. CBX4 recruits PcG proteins and forms nuclear bodies.

-
ATZM‐bl cells were transfected with empty vectors and CBX4‐expressing plasmids, followed by the enrichment of CBX4‐bound proteins. The heatmap represents CBX4‐enriched proteins. Representative genes are shown in table aside the heatmap. The heatmap scale represents fold changes in gene expression (min: −8 fold; max: 8 fold).
-
BSuper‐resolution SIM image of CBX4 in HEK293T cells. DAPI was used to dye DNA which is colored in blue. FITC‐tagged antibodies were used to label endogenous CBX4 which is colored in green.
-
CThe distribution of CBX4 bodies diameters. The black line indicates the median value of diameters which was 512 nm. Data were collected from three cells of three independent samples.
-
DRendered 3D shapes of CBX4 bodies. Three panels represent XY, YZ and XZ planes of one CBX4 body. The right scatter plot represents the distribution of CBX4 bodies sphericities. The black line indicates the median value of sphericities which was 0.9. Data were collected from three cells of three independent samples.
-
EImmunoFISH images of the pseudotyped HIV‐1 genomic DNA and CBX4 bodies in J‐Lat 10.6. Naïve cells were treated with DMSO. Activated cells were treated with TNFα.
-
F–LRFP‐tagged EZH2, RING1B, SUMO4, SUZ12, CHAF1A, DNMT1 and HP1α were co‐overexpressed with GFP‐tagged CBX4 in HEK293T cells. SIM imaging was performed for each combination. The line scan profiles of SIM images which show co‐localization and non‐co‐localization between CBX4 and its partners are shown on the right of each panel. The red arrows in merged images indicate the positions where the line scans are profiled.
-
M–OGFP‐tagged CBX4 was overexpressed in HEK293T cells, followed by treating with AF568‐tagged antibodies against H3K4me3, H3K9me3 and H3K27me3. CBX4 and each histone modification are imaged with SIM. Line scan profiles are shown on the right of each panel. Red arrows in merged images indicate the positions where line scans are profiled.
Data information: Scale bars in (B) and (E–O) represent 5 μm. Scale bars in (D) represent 100 nm. Scale bars in amplified images of (E) represent 500 nm. All the samples were imaged to obtain at least three sets of images.
