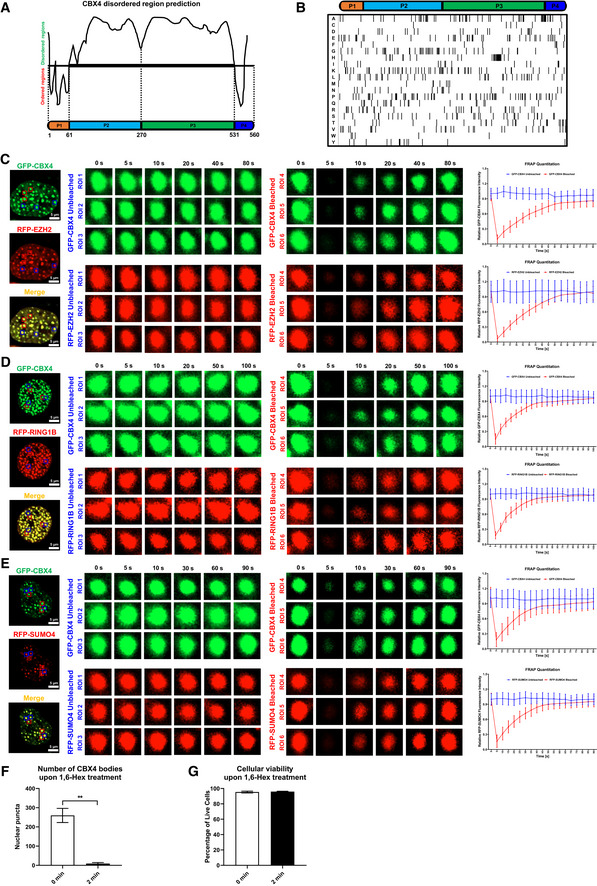
Figure EV3. Proteins in CBX4 bodies were internally diffused.

-
AThe schematic of CBX4 disorder regions. P1 represents the N‐terminal Chromodomain (CD). P2 and P3 represent two sub‐regions of IDR. P3 represents C‐terminal CBox domain.
-
BComposition analysis of CBX4 protein. The lower table indicates the distribution of 20 kinds of amino acids.
-
C–EFRAP images of CBX4 bodies and recruited proteins including EZH2 (C), RING1B (D) and SUMO4 (E). RFP‐tagged EZH2, RING1B and SUMO4 were co‐overexpressed with GFP‐tagged CBX4 in HEK293T cells. Live cell images were captured every 5 s. In each combination, six co‐localization bodies were proceeded to FRAP. Three bodies (ROI 1, ROI 2 and ROI 3) were left untreated. Another three bodies (ROI 4, ROI 5 and ROI 6) were bleached with strong 488 and 561 nm laser power. The right histograms show relative fluorescence intensities of unbleached and bleached CBX4 and its partners in each time point.
-
FThe numbers of CBX4 bodies before 1,6‐Hex treatment (0 min) and after 1,6‐Hex treatment (2 min) were calculated.
-
GCellular viabilities before 1,6‐Hex treatment (0 min) and after 1,6‐Hex treatment (2 min) were evaluated by measuring the percentages of amine‐reactive fluorescent dye non‐permeant cells.
Data information: Scale bars in (C–E) represent 5 μm. All the samples were imaged to obtain at least three sets of images. Data are presented as mean ± SEM in biological triplicate. P‐values in (F) and (G) were calculated by Student’s t‐test. **P < 0.01.
