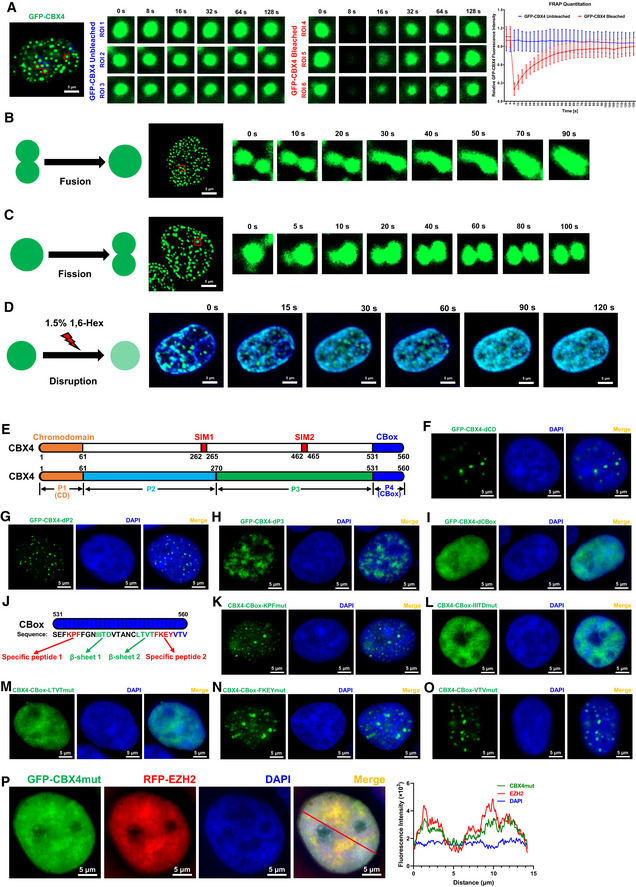
Figure 4. CBX4 bodies are phase‐separated condensates.

-
AFRAP images of CBX4 bodies to indicate the internal diffusion and diffusion across boundary properties. GFP‐tagged CBX4 was overexpressed in HEK293T cells. These live cells were proceeded to time series imaging 24 h post transfection. Six GFP‐CBX4 bodies are circled and marked as region of interest 1 (ROI 1), ROI 2, ROI 3, ROI 4, ROI 5 and ROI 6. Three CBX4 bodies (ROI 4, ROI 5 and ROI 6) were bleached with strong 488 nm laser pulse. Another three unbleached CBX4 bodies (ROI 1, ROI 2 and ROI 3) were set as control. Images were captured every 4 s. The right histogram shows relative fluorescence intensities of unbleached and bleached CBX4 bodies in each time point.
-
B, CRepresentative images of two CBX4 bodies fusing into one and one CBX4 body splitting into two. Images were captured every 5 s.
-
D1.5% 1,6‐hexanediol (1,6‐Hex) compound was used to treat GFP‐tagged CBX4‐expressing live cells. The DNA was stained with Hoechst and is colored in blue. Images were captured every 5 s.
-
EThe schematic of CBX4 backbone. P1 represents Chromodomain (CD). P2 and P3 represent two sub‐regions of IDR, which harbored two SUMO‐interacting motifs named SIM1 and SIM2. P4 represents the CBox domain.
-
F–IGFP‐tagged CBX4 truncation mutants including CBX4‐dCD, CBX4‐dP2, CBX4‐dP3 and CBX4‐dCBox were overexpressed in HEK293T cells and imaged with SIM.
-
JThe schematic of five motifs within CBox domain, including Specific peptide 1 (KPF), β‐sheet 1 (IIITD), β‐sheet 2 (LTVT), Specific peptide 2 (FKEY) and C‐terminal disordered motif (VTV).
-
K–OGFP‐tagged CBX4 mutants including CBox‐KPFmut, CBox‐IIITDmut, CBox‐LTVTmut, CBox‐FKEYmut and CBox‐VTVmut were overexpressed in HEK293T cells and imaged with SIM. The motif mutants were constructed by mutating these motifs into corresponding numbers of alanine residues.
-
PRFP‐tagged EZH2 was co‐overexpressed with GFP‐tagged CBX4 mutant named CBX4mut which was CBX4‐LTVTmut. SIM images were captured. The line scan profile is shown on the right. The red arrow within merged image indicates the line scan position.
Data information: Data are presented as mean ± SEM in biological triplicate in (A). Scale bars in (A), (B–D), (F–I) and (K–P) represent 5 μm. All the samples were imaged to obtain at least three sets of images.
