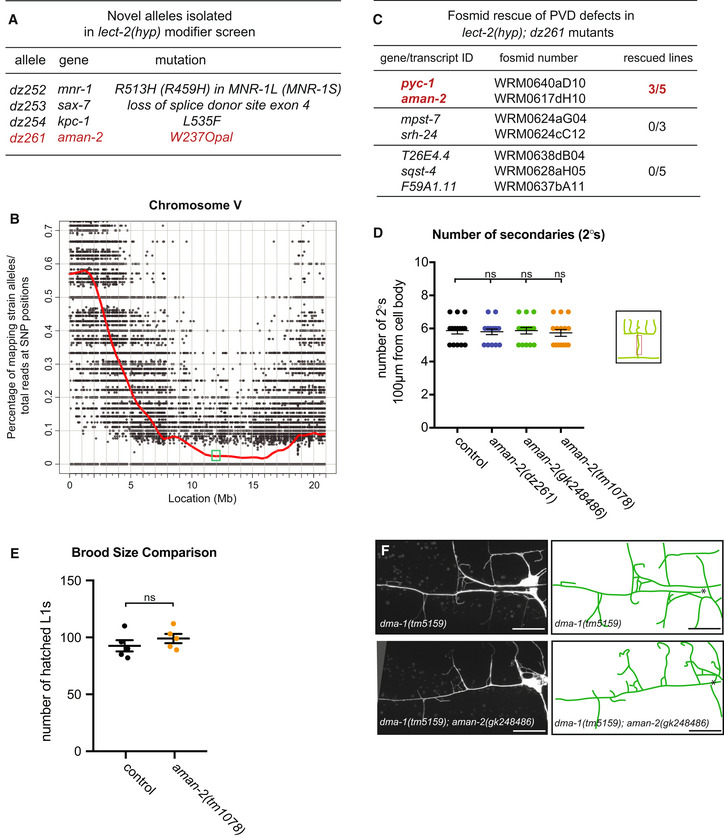
Figure EV1. Results of modifier screen and identification of AMAN‐2/Golgi Alpha‐mannosidase II.

- Table of alleles isolated in the lect‐2(gk864764) hypomorph modifier screen.
- Graph of single nucleotide polymorphism (SNP) results after whole genome sequencing of the dz261 allele (Doitsidou et al, 2016). Axes are denoted above. The green box shows the genomic position of aman‐2.
- Table showing the candidate genes tested as a result of the SNP data in (B). Pools of fosmids covering the regions of indicated transcripts were injected into the lect‐2(hyp); dz261 double mutant. Only the pool containing a fosmid including aman‐2 showed rescue. pyc‐1 was eliminated because a null allele (gk689405) failed to enhance the lect‐2(hyp). Numbers indicate number of biological replicates that showed rescue. 25 animals were scored for each line.
- Quantification of the number of secondary branches (indicated in schematic) in the genotypes indicated. Data are represented as mean ± SEM. Statistical significance was calculated using the Kruskal–Wallis test, ns: no significance. n = 15 for all genotypes and are biological replicates.
- Viability of aman‐2 mutant animals assessed via brood size comparison in the number of eggs that hatched and produced L1 larvae in wild‐type control and aman‐2(tm1078) animals. Data are represented as mean ± SEM. Statistical significance was calculated using the Mann–Whitney test, ns: no significance. n = 5 for all genotypes and are biological replicates.
- Fluorescent images of the dma‐1 null allele, dma‐1(tm5159), alone (top) and in a double null mutant aman‐2(gk248486) background (bottom). Asterisk indicates location of the cell body. Scale bars represent 20 μm.
Source data are available online for this figure.
