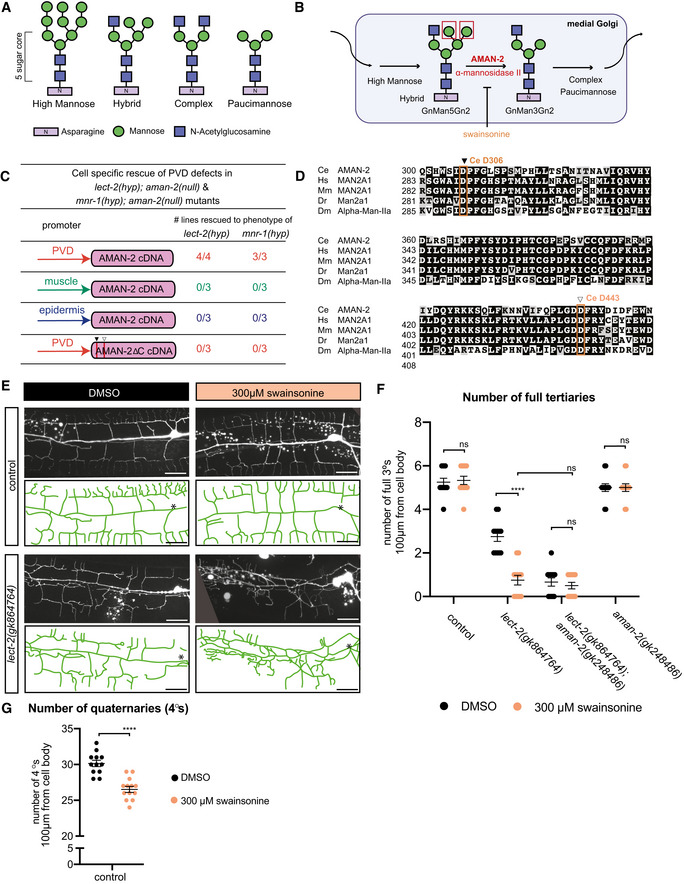
Figure 2. AMAN‐2/Golgi alpha‐mannosidase II requires enzymatic activity in PVD to form higher order branches.

- Types of N‐linked glycans. The shared pentasaccharide core consists of two N‐acetylglucosamines (blue squares) and 3 mannoses (green circles) attached onto an Asparagine residue with an N‐X‐S/T consensus site. Glycan types vary by identity of additional sugars onto the pentasaccharide core.
- Drawing showing the enzymatic activity of AMAN‐2 in the medial Golgi. AMAN‐2 cleaves two specific α1,3 and α1,6 mannose linked residues boxed in red, allowing for the formation of complex and paucimannose type N‐glycans. Arrows denote other enzymes. Swainsonine specifically inhibits enzymatic activity of alpha‐mannosidase II. (Man = mannose, Gn = N‐acetylglucosamine).
- Table showing cell‐specific rescue experiments of PVD defects. AMAN‐2 cDNAs are expressed under the control of PVD, muscle, and epidermal specific promoters in the indicated double mutant backgrounds. Rescue is defined by restoration of the enhanced PVD phenotype back to that of the single hypomorphic mutants alone in aman‐2(gk248486) null mutant backgrounds enhanced by lect‐2(gk846764) or mnr‐1(dz213). 25 transgenic animals and their non‐transgenic siblings were scored for each line. Numbers indicate number of biological replicates that showed rescue.
- Multiple sequence alignment of human MAN2A1 (Hs; acc# NP_002363.2), mouse MAN2A1 (Mm; acc# NP_032575.2), zebrafish Man2a1 (Dr; acc# NP_001103497.2), fruit fly Alpha‐Man‐IIa (Dm; acc# NP_650494.2) and C. elegans AMAN‐2 (Ce; acc# NP_505995.2) created by COBALT (constrained based multiple sequence alignment tool). Conserved catalytic sites D306 (black arrow) and D443 (white arrow) are boxed in orange.
- Fluorescent images and tracings of wild‐type control (top) and lect‐2(gk846764) hypomorphic animals (bottom) fed on plates with 300 µm swainsonine vs. a DMSO control. PVD is visualized by the wyIs581 transgene. The cell body is denoted with an asterisk. Anterior is to the left and dorsal is up in all panels. Vesicular gut autofluorescence is visible as white circular staining. Scale bars represent 20 μm.
- Quantification of the number of full tertiaries in denoted genetic backgrounds (aman‐2 null is gk248486). Black data points indicate DMSO and orange data points show swainsonine treated animals. Data are represented as mean ± SEM. Statistical significance was calculated using the Mann–Whitney test and is indicated (****P ≤ 0.0001, ns = not significant). n = 12 for all genotypes and are biological replicates.
- Quantification of the number of quaternary dendrites in wild‐type control animals fed on plates with and without 300 µm swainsonine. Animals treated with swainsonine show a significant decrease in quaternary branch number, akin to the data in Fig 1C. Data are represented as mean ± SEM. Statistical significance was calculated using the Mann–Whitney test and is indicated (****P ≤ 0.0001). n = 12 for each experiment and are biological replicates.
Source data are available online for this figure.
