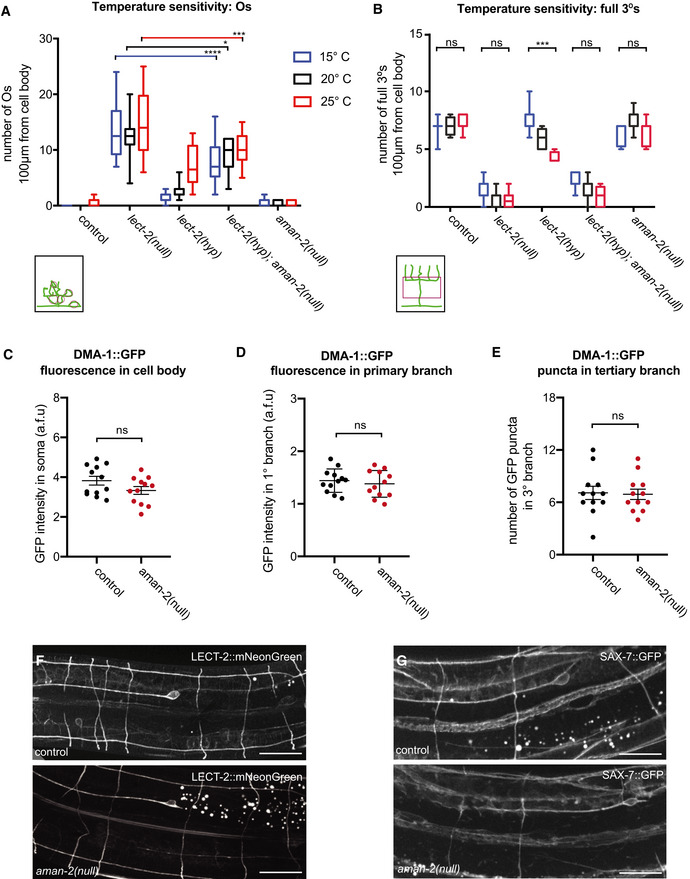
Figure EV2. The requirement of AMAN‐2 in PVD may be specific rather than global.

- Quantification of “Os” (overlapping branches as shown in schematic) of denoted genotypes at different temperatures. Data are presented as box and whisker plots, with the median and 25th and 75th percentile indicated. Whiskers show minimum and maximum. Statistical comparisons were performed using two‐way ANOVA tests, *P ≤ 0.05, ***P ≤ 0.001, ****P ≤ 0.0001, ns: not significant. n > 11 for all groups.
- Quantification of full tertiaries of denoted genotypes at different temperatures. Data are presented as box and whisker plots, with the median and 25th and 75th percentile indicated. Whiskers show minimum and maximum. Statistical comparisons were performed using two‐way ANOVA tests, ***P ≤ 0.001, ns: not significant. n > 11 for all groups.
- Quantification of DMA‐1::GFP fluorescence in control and aman‐2(gk248486) animals. GFP intensity is quantified in arbitrary fluorescent units by dividing the fluorescent area of the soma by the background. Data are represented as mean ± SEM. Statistical comparisons were performed using the Mann–Whitney test, ns: not significant. n = 12 for all genotypes and are biological replicates.
- Quantification of DMA‐1::GFP fluorescence in control and aman‐2(gk248486) animals. GFP intensity is quantified in arbitrary fluorescent units by measuring the fluorescence along the primary dendrite, up to 60 µm anterior from the cell body. Data are represented as mean ± SEM. Statistical comparisons were performed using the Mann–Whitney test, ns: not significant. n = 12 for all genotypes and are biological replicates.
- Quantification of DMA‐1::GFP fluorescent puncta in control and aman‐2(gk248486) animals. Puncta in the tertiary branches 60 µm anterior to the cell body were counted. Data are represented as mean ± SEM. Statistical comparisons were performed using the Mann–Whitney test, ns: not significant. n = 12 for all genotypes and are biological replicates.
- Localization of LECT‐2::mNeonGreen (dz249 endogenous reporter) in wild‐type and aman‐2(dz261) null mutant animals. No obvious differences in general neuronal or hypodermal staining were observed. Vesicular gut autofluorescence is visible as white circular staining. Scale bars represent 20 μm. 15 animals were assessed per genotype.
- Localization of SAX‐7::GFP (ddIs290 fosmid reporter) in wild type and aman‐2(dz261) null mutant animals. No obvious differences in general neuronal or hypodermal staining were observed. Vesicular gut autofluorescence is visible as white circular staining. Scale bars represent 20 μm. 15 animals were assessed per genotype.
Source data are available online for this figure.
