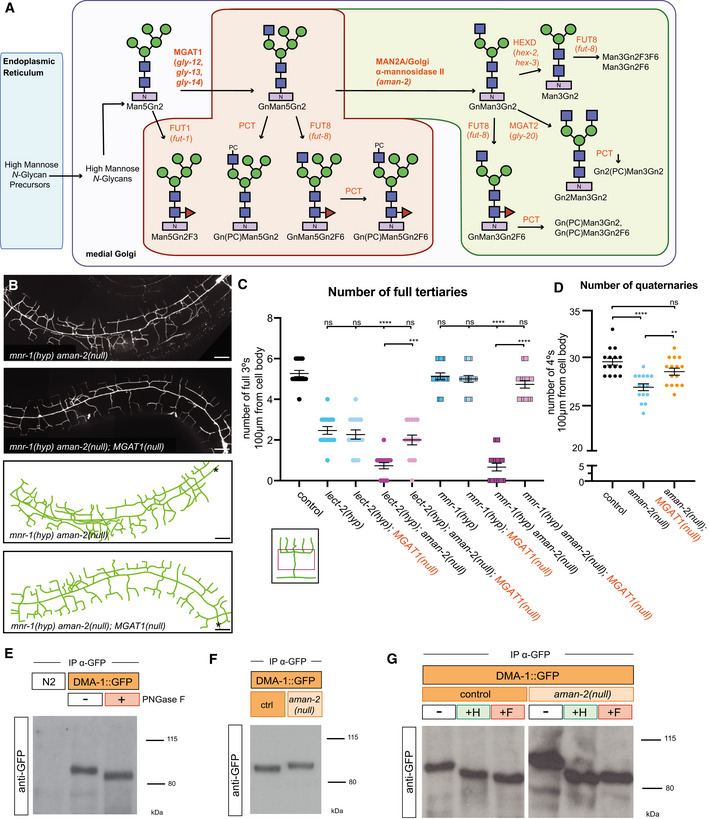
Figure 3. The presence of abnormal N‐glycans in mutants of AMAN‐2/Golgi alpha‐mannosidase II results in defects in PVD arborization.

- Schematic of the conserved N‐glycosylation pathway in C. elegans. The blue box represents the Endoplasmic Reticulum, while the purple box represents the medial Golgi. Glycan residues are consistent with Fig 2A, with the addition of red triangles denoting fucose residues. Arrows and orange text represent enzymes. The green area marks wild‐type N‐glycan chains whereas the red area represents abnormal N‐glycan chains that arise in the absence of AMAN‐2. The glycans in the green area are not formed in the absence of AMAN‐2. (Man = mannose, Gn = N‐acetylglucosamine, F = fucose, PC = phosphorylcholine, MGAT1 = N‐acetylglucosaminyltransferase I, FUT = fucosyltransferase, HEXD = hexosaminidase).
- Fluorescent composite images (top) and tracings (bottom) of mnr‐1(dz213) in an aman‐2(gk248486) and an aman‐2(gk248486); MGAT‐1(null) background. An MGAT null mutant lacks the three C. elegans paralogs: gly‐12, gly‐13, and gly‐14. PVD is visualized by the wyIs581 transgene. The cell body is denoted with an asterisk. Anterior is to the left and dorsal is up in all panels. Scale bars represent 20 μm.
- Quantification of full tertiaries of denoted genotypes. Data are represented as mean ± SEM. Statistical comparisons were performed using the Kruskal–Wallis test. Statistical significance is indicated (***P ≤ 0.001, ****P ≤ 0.0001, ns = not significant). n = 15 for all genotypes and are biological replicates.
- Quantification of the number of quaternary branches in wild‐type control, aman‐2(gk248486) null, and MGAT1(null) animals. Loss of MGAT1 suppresses the decrease in quaternary branch number in the aman‐2(null) background. Data are represented as mean ± SEM. Statistical significance was calculated using the Kruskal–Wallis test and is indicated (**P ≤ 0.01, ****P ≤ 0.0001). n = 15 for all genotypes and are biological replicates.
- Western blot against GFP in C. elegans lysate expressing no transgenes (N2) and expressing DMA‐1::GFP (qyIs369), after precipitating with anti‐GFP antibody. The red boxed plus sign indicates that the lysate is treated with the PNGase F glycosidase. The downward size shift reveals that N‐glycan structures are present on DMA‐1. Ladder is marked in kilodaltons (kDa). The GFP tag contains no N‐glycosylation sites. The experiment was repeated four times with biological replicates.
- Western blot against GFP in C. elegans lysate DMA‐1::GFP (qyIs369), after precipitating with anti‐GFP antibody. Control indicates an otherwise wild‐type background as opposed to an aman‐2(gk248486) null background. The upward size shift in the mutant reveals that the loss of aman‐2 alters the identity of N‐glycan structures on DMA‐1. The experiment was repeated four times with biological replicates.
- Western blot against GFP in C. elegans lysate DMA‐1::GFP (qyIs369), after precipitating with anti‐GFP antibody. Control indicates an otherwise wild‐type background as opposed to an aman‐2(gk248486) null background. The red boxed +F indicates that the lysate is treated with the PNGase F glycosidase, while the green boxed +H corresponds to the Endo H glycosidase, which cleaves high‐mannose and hybrid type N‐glycans. For complementary experiments using the Endo D glycosidase, which cleaves paucimannose type N‐glycans, see Fig EV4B. Size shifts indicate that some hybrid/high‐mannose structures are present on DMA‐1 (left), and that the aman‐2 mutant results in only hybrid/high‐mannose structures on DMA‐1 (right). The experiment was repeated four times with biological replicates.
Source data are available online for this figure.
