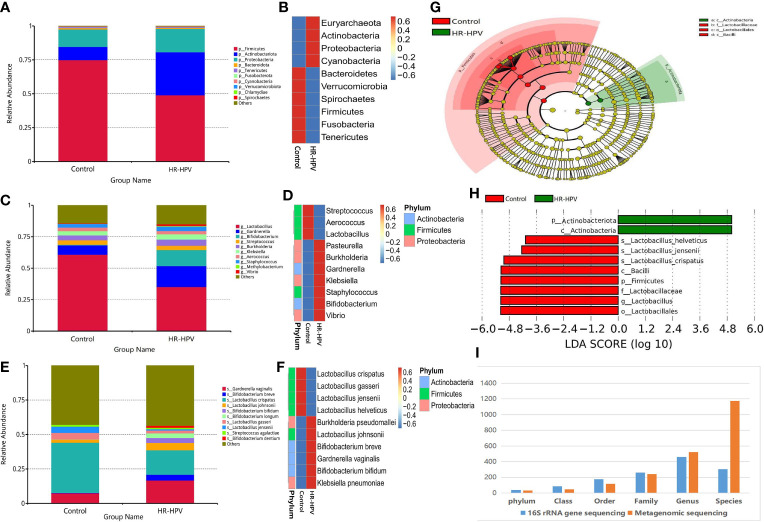
Figure 3.
Microbial composition based on metagenomic sequencing. (A) Relative abundance of the cervical microbiota at the phylum level. (B) Cluster heatmap of relative abundance at the phylum level. (C) Relative abundance of the cervical microbiota at the genus level. (D) Cluster heatmap of relative abundance at the genus level. (E) Relative abundance of the cervical microbiota at the species level. (F) Cluster heatmap of relative abundance at the species level. (G) LEfSe cladogram by metagenomic sequencing of the cervical microbiota in the two groups. Microbial compositions were compared at different species levels, from phylum in the outermost ring to family in the innermost ring. (H) Distribution histogram of LDA score assessed for species with biomarker significance between the HR-HPV infection and uninfected women (P<0.05; LDA score >4). (I) Comparison of the accuracy of identifying bacteria between the 16S rRNA gene and metagenomic sequencing.

