
Figure 2. Detection limit of mass spectrometry methodology.
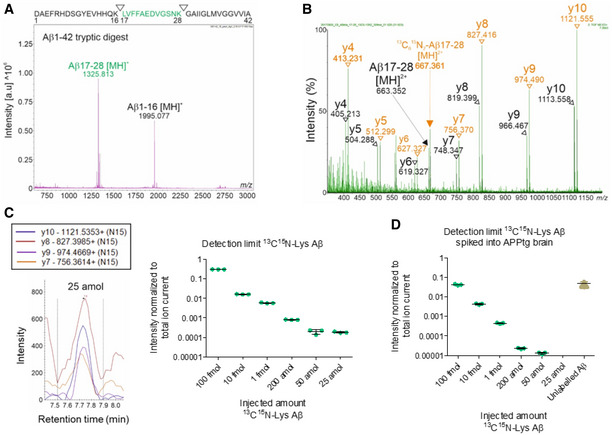
- MALDI‐TOF mass spectrum of trypsin‐digested, synthetic Aβ1‐42 (10 pmol). The Aβ17‐28 [MH]+ fragment was detected with the highest intensity. Measurements in reflectron positive mode. The sequence of Aβ1‐42 with the tryptic cleavage sites is indicated at the top.
- MS/MS spectrum of unlabeled Aβ17‐28 and 13C15N‐Lys Aβ17‐28 synthetic peptides in the 50 fmol range. m/z of precursors ions (m/z 663.34 for Aβ17‐28 [MH]2+, m/z 667.36 for 13C15N‐Lys Aβ17‐28 [MH]2+) and their derived fragments are indicated as a series of y ions (y4‐y10). The peptides were analyzed in data‐independent acquisition MSE mode.
- Decreasing quantities of synthetic 13C15N‐Lys Aβ1‐42 were trypsin‐digested and analyzed by MRM. The intensities of 4 transitions (y10, y9, y8, and y7) were assessed for 13C15N‐Lys Aβ17‐28, showing a detection limit level of 25 amol. Measurements in technical triplicates, normalization to total ion current. Error bars show mean ± SD.
- Decreasing quantities of synthetic 13C15N‐Lys Aβ1‐42 were spiked into the insoluble fraction of APPtg brains, immunoprecipitated, trypsin‐digested, and analyzed by MRM. Assessment of the intensities of y10, y9, y8, and y7 showed a detection limit level of 50 amol for 13C15N‐Lys Aβ17‐28 and detected an excess of brain‐derived unlabeled Aβ17‐28. Measurements in technical triplicates, normalization to total ion current. Error bars show mean ± SD.
Source data are available online for this figure.