
Figure 3. Intraperitoneally injected 13C‐Lys Aβ is detectable in the periphery long after injection.
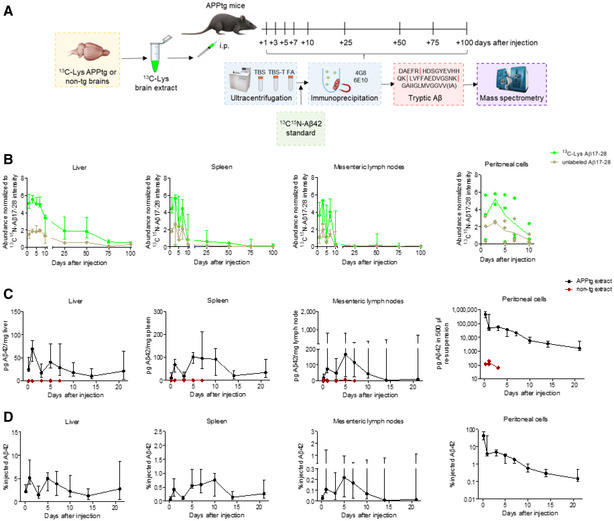
- Experimental design. i.p., intraperitoneal.
- Temporal MRM analysis of 13C‐Lys Aβ17‐28 and unlabeled Aβ17‐28 in the liver, spleen, mesenteric lymph nodes, and peritoneal cells after 13C‐Lys‐APPtg brain extract i.p. injection (n = 3 mice per time point and tissue at 1–10 days, except for n = 2 mice for peritoneal cells at 3 days; n = 4 mice per time point and tissue at 25–100 days, except for n = 3 mice for spleen at 100 days). Measurements in technical triplicates, normalization to 13C15N‐Lys Aβ17‐28 intensity as a spiked internal standard and additionally to organ weight (mg) for lymph nodes. Error bars show median ± interquartile range.
- Temporal 4G8 immunoassay quantification of Aβ42 in the liver, spleen, mesenteric lymph nodes, and peritoneal cells after unlabeled APPtg (n = 8 mice at 5 h to 7 days, except for n = 5 mice for peritoneal lavage, n = 5 mice at 10–14 days, n = 4 mice at 21 days) or non‐tg brain extract injection (n = 2 mice at 5 h and 3 days, n = 3 mice at 1 day, n = 1 mouse at 5 and 7 days, except for peritoneal cells where n = 1 mouse at 5 h and 3 days, and n = 2 mice at 1 day). Error bars show median ± interquartile range.
- Normalization of APPtg extract group data presented in (C) to organ weight (mg) and injected Aβ amount (range 1,027–1,426 ng). Error bars show median ± interquartile range.
Source data are available online for this figure.