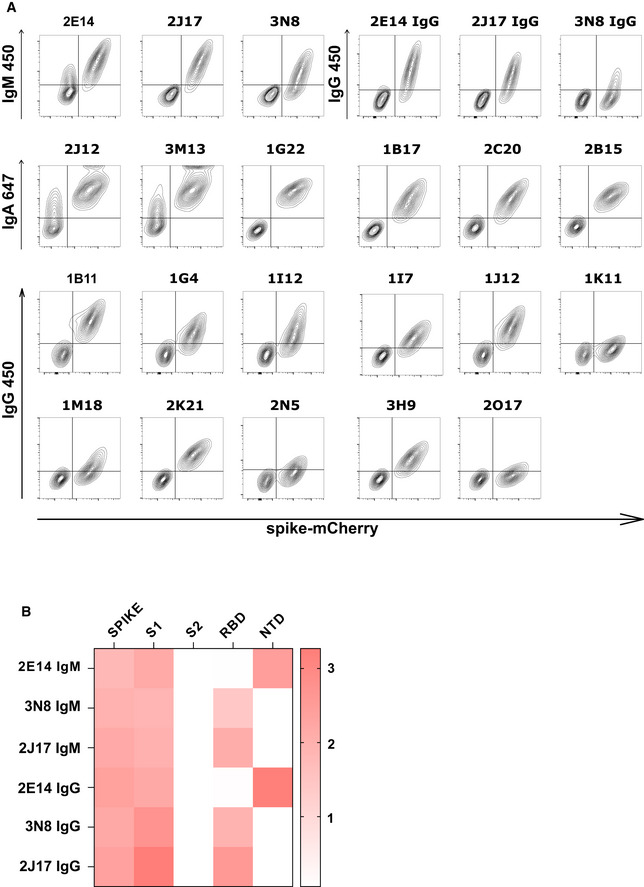
Figure EV2. Spike and epitope binding by monoclonal antibodies.

- Spike recognition by monoclonal antibodies assessed by flow cytometry. Each contour plot shows mCherry on the horizontal axis, so that spike‐mCherry expressing cells are on the right of the plot, and TE 0 cells on the left. Vertical axes show signal of secondary antibodies used to detect IgM, IgA, or IgG.
- Heatmap of antibody binding to spike protein subdomains (complete spike extracellular domain "spike", S1, S2, RBD and NTD) in ELISA. Color gradient correspond to the OD of each sample. The top three rows show binding of native IgM. The lower three rows show binding of the same antibodies, expressed as IgG1.
