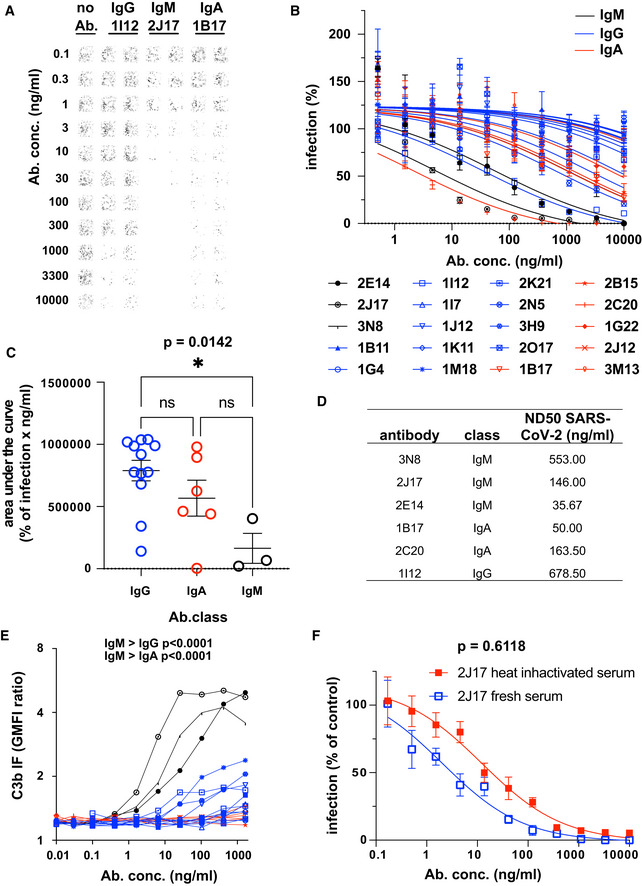
Figure 3. Native IgM antibodies specific for SARS‐CoV‐2 spike protein mediate virus neutralization.

- Example of neutralization of chimeric VSV*ΔG‐SΔ21 by donor‐derived IgG, IgM and IgA antibodies. 100 pfu VSV*ΔG‐SΔ21 was mixed with antibody at specified concentrations for 1 h and then added to Vero cells. After 24 h, the cells were imaged and infected wells identified by GFP expression, here pseudocolored with GFP‐bright shown in black against a white background. Virus neutralization is manifested as reduction in GFP. Images shown here come from wells infected with virus alone (left column), virus pre‐incubated with the moderately neutralizing IgG 1I12 (second and third columns), the potent neutralizing IgM 2J17 (fourth and fifth columns), or with the moderately potent IgA 1B17 (sixth and seventh columns). Each antibody was tested in the range of concentrations shown to the left of the images, from 10,000 down to 0.1 ng/ml.
- Neutralization curves from each of the cloned antibodies using plaque reduction assay of VSV*ΔG‐SΔ21. The horizontal axis shows the serial dilution of the antibodies. The vertical axis shows, for each well exposed to antibody, the ratio of infected cell plaque count to the corresponding value from control wells without antibody. Each point is the mean of 9 values pooled from three independent experiments each with triplicate wells. Error bars indicate standard error. Antibodies tested are listed below the figure and include 3 IgM (black lines and symbols), 11 IgG (blue lines and symbols), and 6 IgA (red lines and symbols).
- Quantification of results from (B). Area under the curve is plotted for every antibody and compared between different antibody classes by one‐way ANOVA followed by Tukey's test (mean from three biological replicates and SEM). Area under the curve was chosen as a measure of neutralization capacity, rather than ND50 (as used in subsequent figures), because some antibodies included in this figure exhibited no neutralization at the concentrations tested, precluding the calculation of an ND50.
- SARS‐CoV‐2 Neutralization Test. Antibodies that showed neutralization of the chimeric VSV*ΔG‐SΔ21 were tested for neutralization of wild‐type SARS‐CoV‐2 virus. Concentrations of antibodies needed to neutralize100 pfu are expressed as ND50 (mean from two independent experiments, each with quadruplicate wells, or 3 independent experiments for 2E14 and 2J17). The ND50 of 2E14 was lower than 2J17 in three independent experiments although this difference was not significant by paired two‐tailed t‐test (P = 0.3876).
- Flow cytometric determination of antibody‐dependent complement deposition on cells. Cells expressing SARS‐CoV‐2 spike protein and untransfected control cells were incubated with various concentrations of antibody in the presence of fresh human serum (from a SARS‐CoV‐2 unexposed donor). Activation of the complement cascade was measured by flow cytometric assessment of complement component C3b deposition on the surface of the cells. Results for the 3 IgM, (black), 11 IgG, (blue), and 6 IgA antibodies (red) are shown. P values were calculated by two‐way analysis of variance, followed by Tukey's test.
- Influence of complement on virus neutralization. A plaque reduction neutralization assay like that shown in Fig 3A–C was conducted with IgM 2J17 in the presence of either fresh, complement‐sufficient human serum, or heat‐inactivated serum. The concentration of 2J17 is shown on the horizontal axis. The vertical axis shows, for each well exposed to antibody, the ratio of infected cell plaque count to the corresponding value from control wells with serum (either fresh or inactivated) but without antibody. The points plotted with filled red symbols corresponds to the condition with heat‐inactivated serum, and the open blue symbols results with fresh serum. Each symbol corresponds to the mean of nine wells pooled from three independent experiments, each with triplicate wells. Error bars correspond to standard error. P value was calculated using a paired, two‐tailed t‐test.
