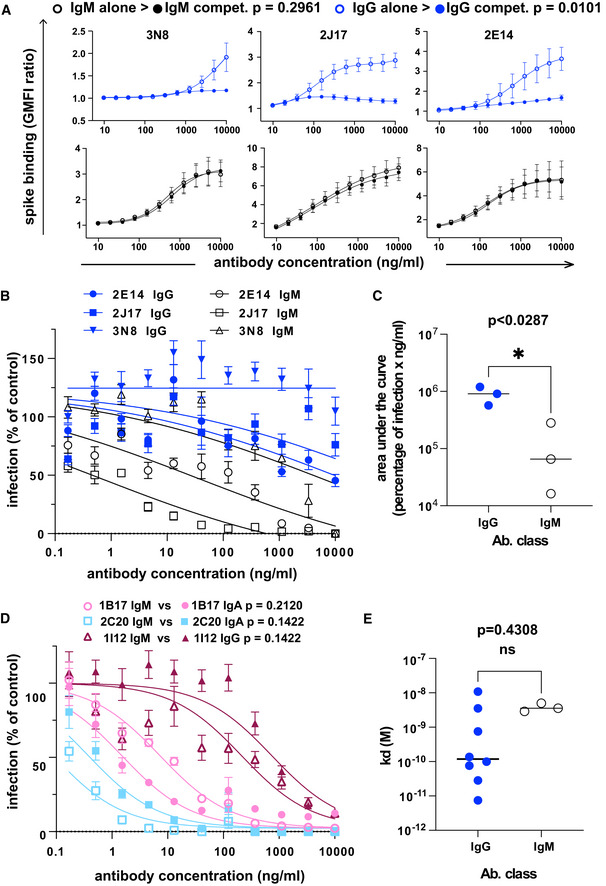
Figure 4. Class dependency of neutralization by spike‐specific IgM.

- The effect of competition on concentration versus binding curves of three spike‐specific, class‐switched antibodies. Antibodies were expressed either as IgM, as originally isolated (black symbols and lines), or artificially switched to IgG1 (blue lines and symbols). For each antibody, identified by name at the top of each plot, the binding of the antibody alone (“alone”, open symbols), or the competitive binding of the antibody in a mixture of IgM and IgG1 (“compet.”, filled symbols) is shown. In the competition scenario, each of the two classes of the antibody were added together at the concentration shown on the horizontal axis. The vertical axis shows the ratio of geometric mean fluorescence of human IgM, or IgG on spike‐expressing cells divided by the corresponding signal on spike‐non‐expressing control cells. Each point shows the mean of 3 values from three independent experiments. Error bars show standard error. P value was calculated by comparing the area under the curve of each antibody class in the “alone” condition with the binding of the “competition” condition by paired, two‐tailed t‐test.
- Virus neutralization by antibodies expressed as IgM or IgG1. A plaque reduction neutralization assay as described in Fig 3A and B was used to measure neutralization by the three, donor‐derived IgM (black lines and open symbols) and their artificially class‐switched IgG1 equivalents (blue lines and filled symbols). Horizontal axis shows the antibody concentration and the vertical axis shows the level of infection expressed as percentage GFP expression compared to control wells with no antibody added. Each point shows the mean of nine replicate values pooled from three independent experiments, each with triplicate wells. Error bars show standard error.
- Comparison of virus neutralization by antibodies expressed as IgM or IgG1 shown in B. Area under the curve was calculated from each of the three independently performed experiments. P was calculated by paired, two‐tailed t‐test.
- Affinities of donor‐derived spike‐binding IgG1 (n = 8) and donor‐derived IgM (n = 3) expressed as IgG1, measured by surface plasmon resonance. P value was calculated by unpaired two‐tailed t‐test. The Kd derived from each antibody measurement are shown in Appendix Table S5. Sensograms of each tested antibody are shown in Fig EV2.
- Virus neutralization by antibodies artificially class switched from IgA or IgG1 to IgM. A plaque reduction neutralization assay as described in Fig 3A and B was used to measure neutralization by the two donor‐derived IgA (pink and light blue lines) and one donor‐derived IgG (Bordeaux lines). The antibodies expressed in their original classes (IgA or IgG) are plotted with filled symbols of the same colors as the lines, and their artificially class‐switched IgM equivalents are plotted with open symbols. Horizontal axis shows the antibody concentration and the vertical axis shows the level of infection expressed as percentage GFP expression compared to control wells with no antibody added. Each point shows the mean of nine replicate values pooled from three independent experiments, each with triplicate wells. ND50 was calculated from each of the three independently performed experiments. P was calculated by paired, two‐tailed t‐test for each antibody pair.
