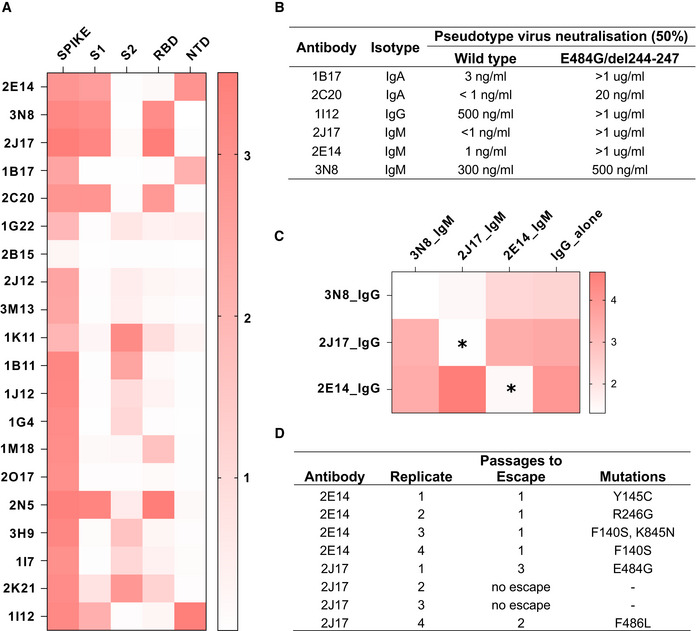
Figure 5. Epitopes recognized by spike‐binding antibodies.

- Heatmap of antibody binding to spike protein subdomains (complete spike extracellular domain “spike”, S1, S2, RBD and NTD in ELISA. Color gradient shown on right represents optical density at 450 nm (OD). Values are mean OD from two independent experiments. Analogous ELISA results for 3 IgM and their IgG1‐class‐switched derivatives are shown in Fig EV2B.
- Susceptibility of different neutralizing antibodies to spike protein mutations. A neutralization assay was performed with 3 IgM, 1 IgG and 2 IgA using VSV*ΔG(FLuc) pseudotyped with wild‐type (wt) spike protein or with spike variant harboring the deletion of amino acids 244–247, located in the NTD, and the substitution E484G, located in the RBD, from a SARS‐CoV‐2 isolate from an immunosuppressed COVID‐19 patient (del244‐247/E484G). ND50 values were determined from quadruplicate wells, from an experiment performed once. Neutralization curves are shown in Fig EV4.
- Flow‐cytometric epitope binning of monoclonal IgM, utilizing competitive displacement of IgG by IgM with identical variable region (as shown in Fig 4A). Cells expressing SARS‐CoV‐2 spike protein and untransfected control cells were incubated with each of 3 neutralizing IgM antibodies artificially switched to IgG1, either alone, or mixed with one of the 3 antibodies expressed as IgM. The binding of each IgG1 alone is shown in the last column of the heatmap, and in competition with each other IgM in columns 1‐3. Color shade represents the specific IgG binding (ratio of GMFI on TE spike‐mCherry cells to TE 0 cells). Values are mean GMFI ratios from three independent experiments. When IgM binds the same epitope as the IgG (automatically the case when the source antibody is the same), the IgM will displace the IgG, resulting in a reduction in the IgG signal. Asterisks mark those combinations of antibodies with a statistically significant decrease in binding of the IgG1 in the presence of IgM, compared to the IgG alone across 3 independent experiments, (*P < 0.05, two‐way analysis of variance, followed by Tukey's test).
- Summary of escape mutations induced by potent neutralizing IgM 2E14 and 2J17. Vero cells in 24‐well plates were infected with VSV*ΔG‐SΔ21, in the presence of serial dilutions from 10 µg per ml of neutralizing antibody (or without antibody as control), and 2 days later, virus from the well containing the highest concentration of antibody that still showed some virus proliferation was used to infect fresh wells of Vero cells, again in the presence of antibody in a serial dilution. The process was repeated for three passages, and at the last passage, the cells were lysed, RNA extracted, reversed transcribed and sequenced, and consensus spike gene reads extracted and aligned against the reference SARS‐CoV‐2 genome MN908947.3. The table shows de novo amino acid mutations that arose in each of four replicates with each of the two neutralizing antibodies, as well as the number of passages needed for the escape mutant to emerge. In two of the replicates with 2J17, no escape was observed. Consensus sequences of spike genes from each replicates and from control wells with no antibody added are shown in Dataset EV2.
