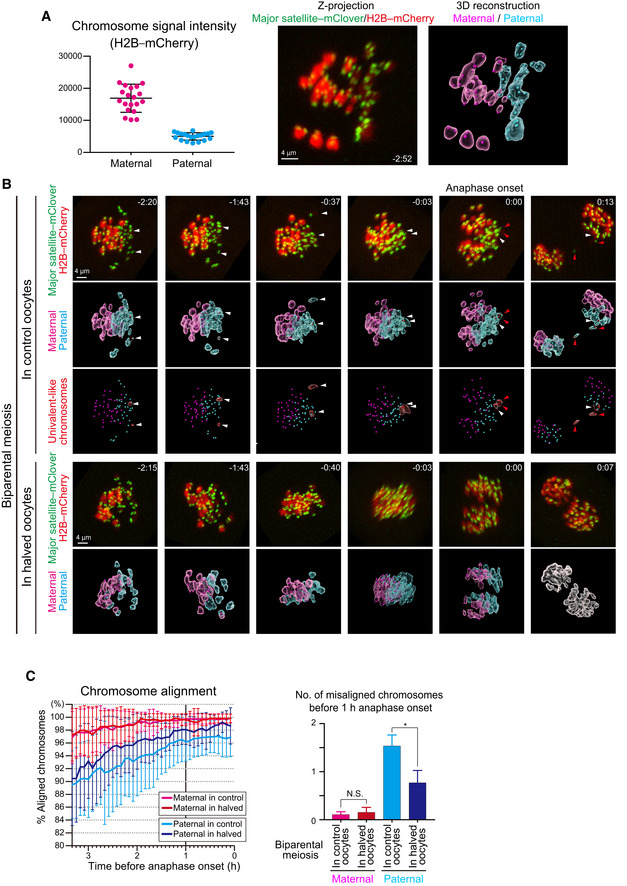
Figure 2. Live imaging of biparental meiosis.

- Identification of parental origin of the chromosomes was distinguishable based on H2B–mCherry fluorescent intensities (paternal chromosomes exhibit lower intensities; n = 20 oocytes). Bars and error bars denote means ± SD. The z‐projection image shows major satellite–mClover (centromeres, green) and H2B–mCherry (chromosomes, red). Time from anaphase onset is shown in h:min. Scale bar = 4 μm. The 3D‐reconstructed image shows maternal (magenta) and paternal (cyan) chromosomes. Spots indicate centromeres.
- Chromosome tracking in 3D. The reconstructed images are viewed from the side of the metaphase plate. Signals are interpolated in the Z axis for visualization. White and red arrowheads, as well as red surfaces, indicate univalent‐like chromosomes that underwent unbalanced predivision (premature segregation of sister chromatids). Scale bar = 4 μm.
- Halving the recipient ooplasmic mass rescued chromosome alignment. The numbers of misaligned chromosomes and their parental origin were determined in 3D (n = 39 and 17 oocytes). Error bars show the standard deviation. Student’s t‐test was used to compare means. *P < 0.05. N.S., not significant.
