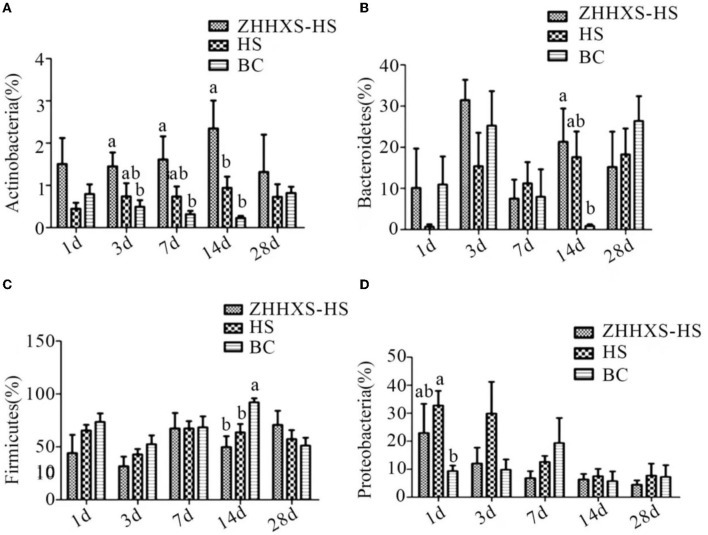
Figure 6.
The changes of abundance at the phylum level through taxon-based analysis. (A–D) shows the abundance of Actinobacteria, Bacteroidetes, Firmicutes, and Proteobacteria among different groups across time, respectively. The significance of variance was analyzed by one-way ANOVA. The different letter represents p < 0.05 and there was an obvious difference.

