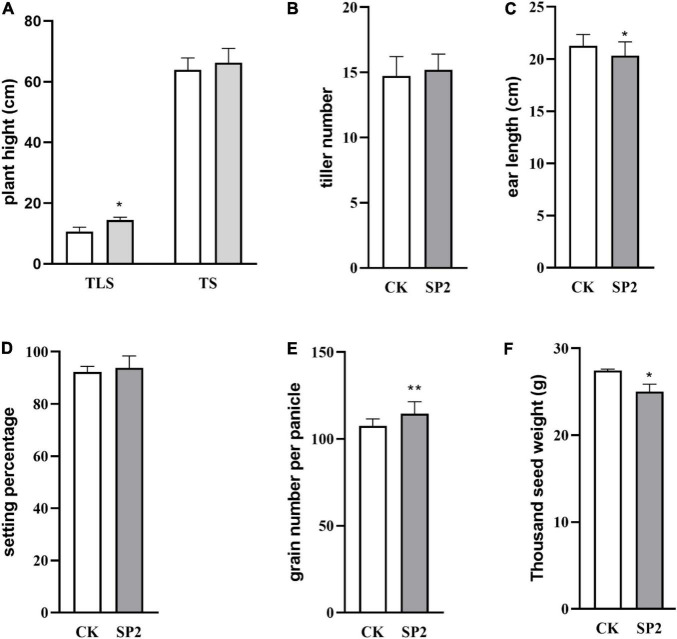
FIGURE 1.
Change of plant height (A), tiller number (B), ear length (C), setting percentage (D), grain number per panicle (E), thousand seed weight (F) in rice different stages of growth and development. (TLS, three-leaf stage; TS, tillering stage; White column represents the control group; Gray column represents treatment group). Data are mean ± SD, n = 30, * and ** indicate significant difference at p < 0.05 and p < 0.01 by student t-test, respectively.

