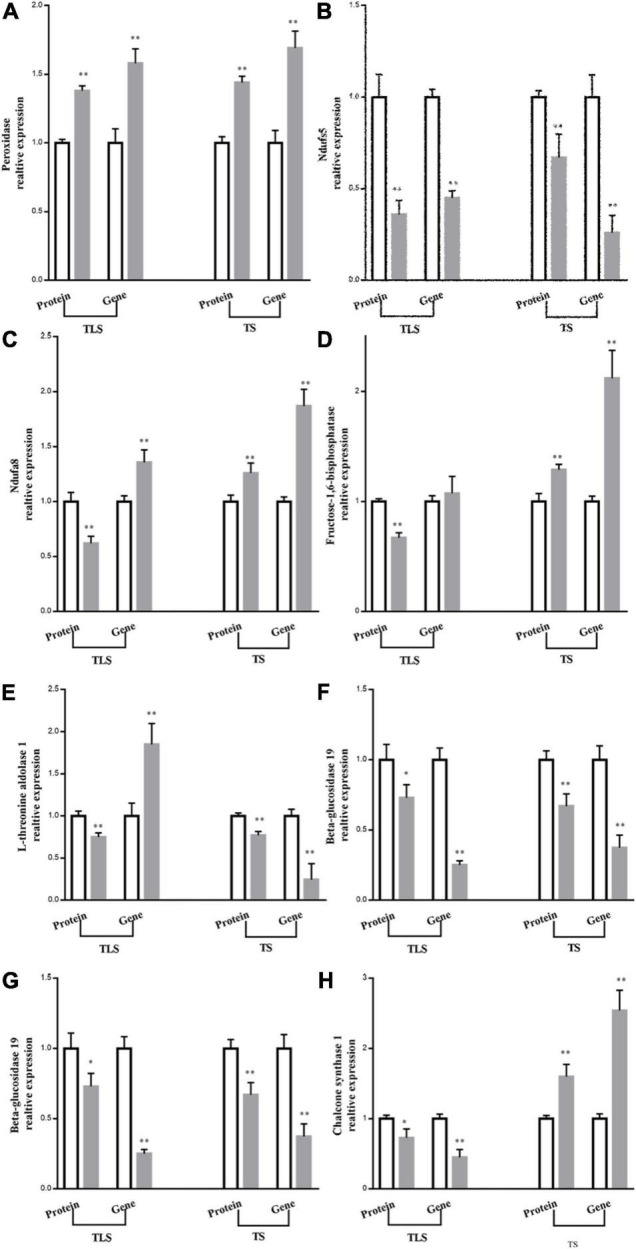
FIGURE 10.

Comparison between protein abundance and mRNA level. The protein abundance in ground treatment and after spaceflight treatment leaves at three-leaf stage (TLS) and tillering stage (TS) were assessed by ITRAQ based quantitative proteome analysis. Transcript abundance at two development stages (TLS, TS) was determined by quantitative RT-PCR and normalized against the ACTIN gene. The white column represents the control group; gray column represents treatment group. The means and standard error values from three independent samples are shown (means ± SE; n = 3). * and ** indicate significant difference at p < 0.05 and <0.01 by student t-test, respectively.
