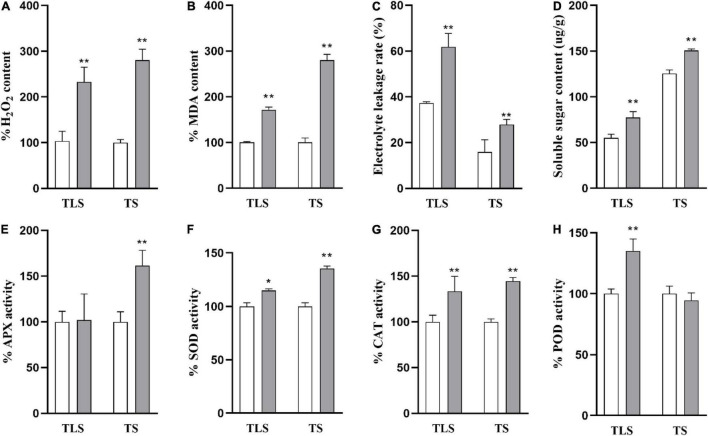
FIGURE 2.
The physiological changes of rice induced by spaceflight. (A) Percent values of H2O2. (B) Percent values of MDA. (C) The soluble sugar contents. (D) The electrolyte leakage rate change. (E) Percent values of APX activity. (F) Percent values of SOD activity. (G) Percent values of CAT activity. (H) Percent values of POD activity (TLS, three-leaf stage; TS, tillering stage; White column represents the control group; Gray column represents treatment group. The data (mean ± SD) are the means of three replicates with standard errors shown by vertical bars, n = 3, * and ** indicate significant difference at p < 0.05 and <0.01 by student t-test, respectively.

