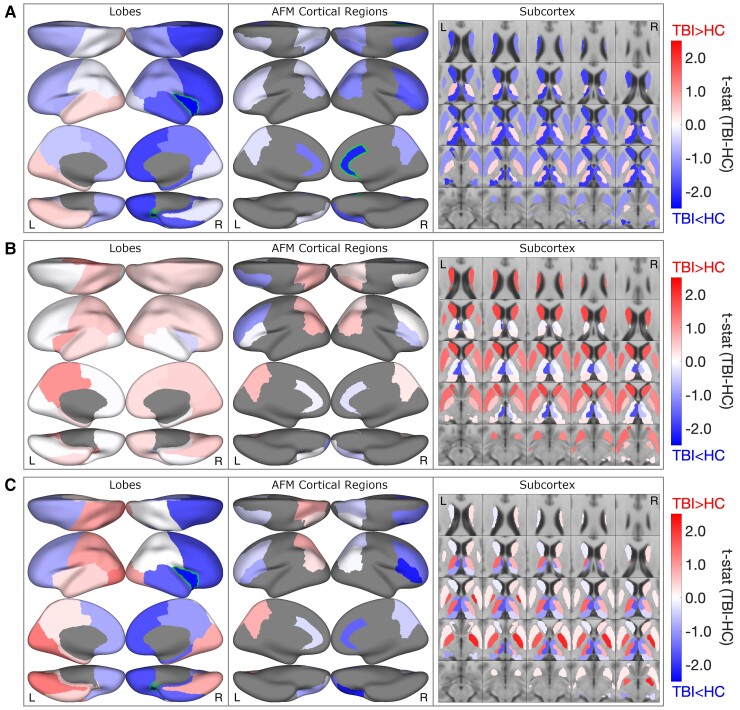
Figure 2.
Group-level regional [11C]FMZ tracer BPND in individuals with TBI compared to controls. HC: healthy controls. (A) Group differences in [11C]FMZ tracer BPND in individuals with TBI at sub-acute timepoint (n = 9) and control individuals without TBI (n = 20). T-stat of the group differences. Outline: uncorrected P < 0.05. All regional values were z-scored after adjusting for age and cortical thickness/subcortical volume based on healthy controls. Regions with values less than zero represent TBIsubacute < controls and regions with values greater than zero represent TBIsubacute > controls. Reduced BPND is seen in the frontal lobes, striatum and posterior-medial thalami (R > L). (B) Longitudinal changes in [11C]FMZ tracer BPND in adults with TBI compared to between-scan changes in control individuals without TBI. Regions with values less than zero represent longitudinal decreases in subjects with TBI that are greater than longitudinal variability in controls. Regions with values greater than zero represent longitudinal increases in subjects with TBI that are greater than longitudinal variability in controls. Broad relative increases in BPND are seen across cortical regions in subjects with TBI excepting the left frontal lobe; subjects with TBI demonstrated increased BPND across bilateral caudate and putamen. Changes in BPND have been adjusted for age and cortical thickness/subcortical volume differences between the groups. (C) Group differences in [11C]FMZ tracer BPND in individuals with TBI at chronic timepoint (n = 7) and control individuals without TBI (n = 20). Regions with values less than zero represent TBIsubacute < controls and regions with values greater than zero represent TBIsubacute > controls. A heterogenous pattern of changes is noted with persistently lower bifrontal BPND and markedly increased bilateral pallidal BPND in subjects with TBI.

