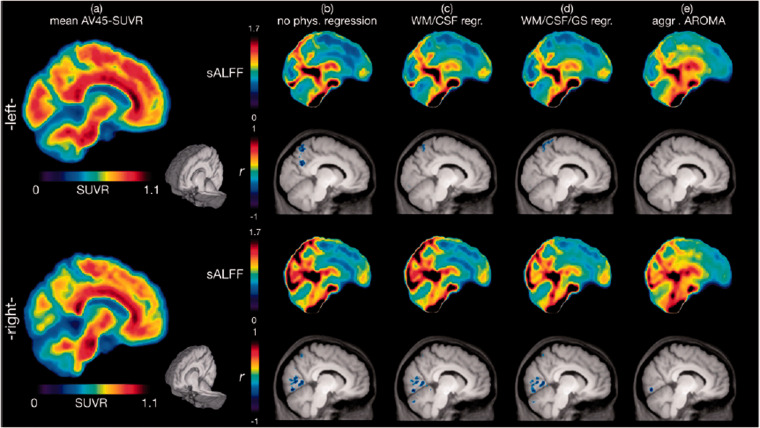
Figure 2.
Voxel-wise correlation analysis between brain amyloid-β deposition and the standardized amplitude of low-frequency BOLD signal fluctuations (sALFF). Images represent slices near the mid-sagittal region (right and left 9.25 mm in MNI space). (a) mean AV45-SUVR (standardized uptake value ratio with the white matter as a scaling reference) color maps of 33 amnestic mild cognitive impairment participants are shown along with the corresponding mean sALFF (standardized amplitude of low-frequency fluctuations) color maps after the physiological signal cleaning procedures of (b) “no physiological regression”, (c) “WM/CSF regression”, (d) “WM/CSF/GS regression” and (e) “aggressive AROMA”. Significant correlation clusters between AV45-SUVR and sALFF for each regression procedure (b)-(e) are shown in the row below the mean sALFF images. Clusters are depicted in blue, as r values are negative (see Table 2 for detailed statistical analysis data). AV45-SUVR maps are nearly identical if the cerebellum, instead of white matter, is used as a reference, except the color scale range becomes 0 to 2. As more global variance is removed with each regression step, the normalization of sALFF reveals local signal oscillations.

