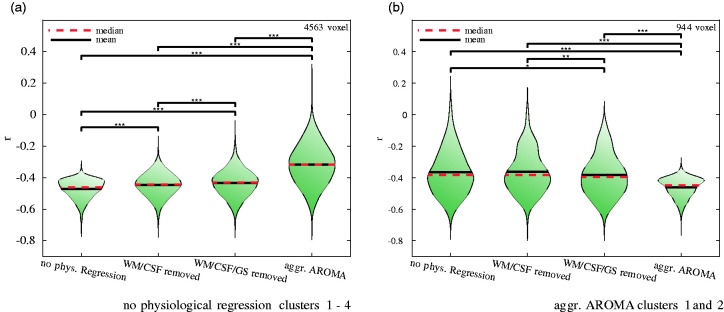
Figure 4.
Impact of stepwise regression of upper-stream vascular effects on the correlations between brain amyloid-β deposition and the amplitude of low-frequency BOLD signal fluctuations (sALFF) in the significant clusters identified with “no physiological regression” (a) and “aggressive AROMA” (b). Stars on brackets denote significance levels of paired Mann-Whitney U-tests with *p ≤ 0.05, **p ≤ 0.01, ***p ≤ 0.001. Fisher z transformed r-value distributions shown in violin plots: (a) Using the r-values of all voxels within the significant clusters reported in Table 2 under “no physiological regression”. This comparison shows a stepwise decrease of negative correlation magnitude as more aggressive physiological signal removal procedures were applied, suggesting that BOLD-fluctuations at these voxel locations are more driven by upper-stream vascular effects; (b) Using the r-values of all voxels within the significant clusters reported in Table 2 under “aggressive AROMA”. This comparison shows a stepwise increase of negative correlation magnitude as more aggressive physiological signal removal procedures were applied, suggesting that BOLD fluctuations at these voxel locations are more likely driven by neuronal activity.

