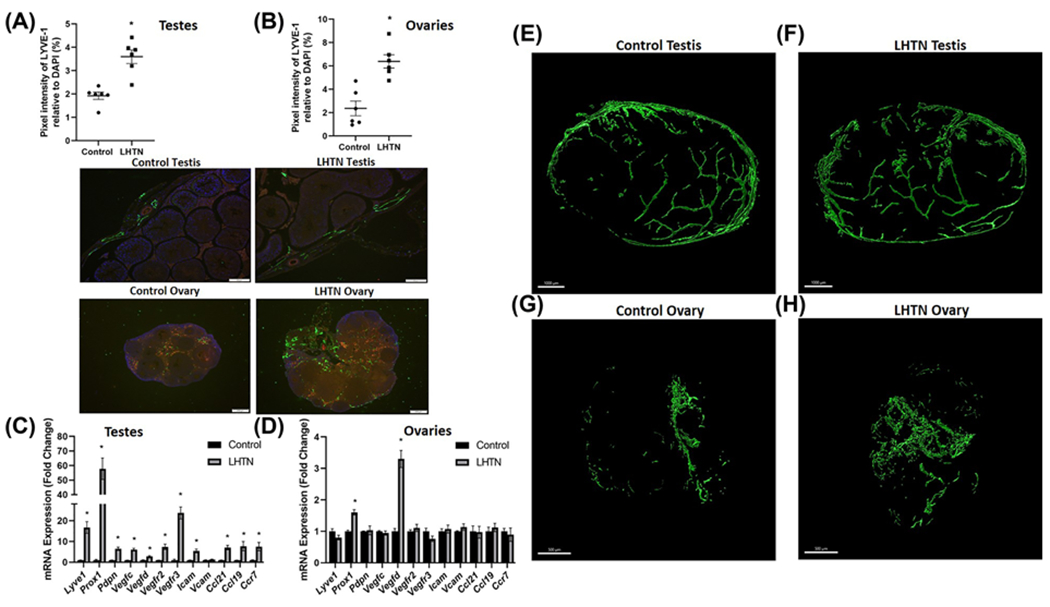
Figure 5. LHTN increased lymphatic vessel density in the gonads.

Lymphatic vessel density in (A) testes and (B) ovaries from the control and LHTN mice as determined by LYVE-1+ pixels relative to DAPI per field (n=6 in both males and females). Representative images of LYVE-1 immunofluorescence in testis (scale bar = 100 μm) and ovary (scale bar = 200 μm) sections. Green: LYVE-1; Red: CD31; Blue: DAPI. Gene expression of lymphatic vessel markers in (C) testes and (D) ovaries from the control and LHTN mice (n=6 in both males and females). Results are expressed as mean ± SEM, and statistical analyses consisted of Student’s t test. *P<0.05 vs control. Representative 3-D model of confocal images of clear, unobstructed brain/body imaging cocktails and computational analysis (CUBIC) cleared testis immunostained with LYVE-1 from (E) the control and (F) LHTN mice, n=3. Representative 3-D model of confocal images of clear, unobstructed brain/body imaging cocktails and computational analysis (CUBIC) cleared ovary immunostained with LYVE-1 from (G) the control and (H) LHTN mice, n=3. Scale bars = 1000 μm (testis) and 500 μm (ovary).
