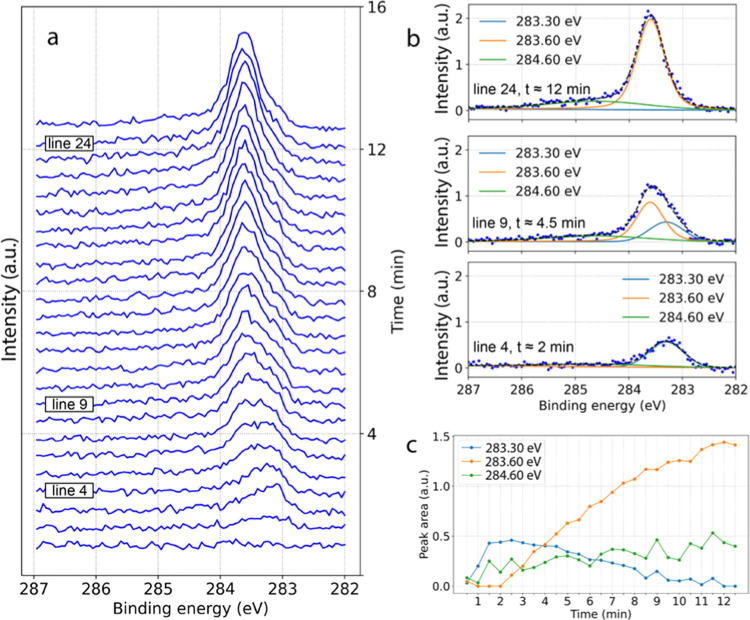
Figure 4.
(a) Set of XP spectra of the C 1s region recorded using 4.6 keV photons for an Fe(110) single-crystal surface heated to 233 °C and exposed to 1CO:4H2 gas mixture at a 2 Ln/min total flow and a 200 mbar pressure. Each spectrum took about 30 s, and the whole set of 25 spectra was accomplished in approximately 12.5 minutes; (b, c) examples of the fitting for lines 4, 9, and 24 corresponding to 2, 4.5, and 12 min experimental time, respectively, and peak area trends for the whole sequence in panel (a).

