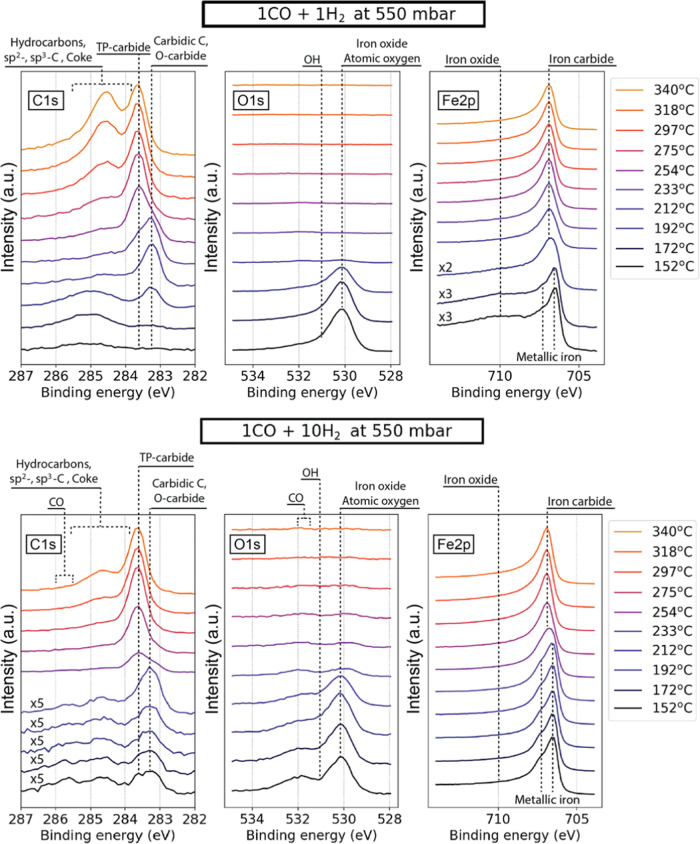
Figure 5.
Photoelectron spectra of C 1s, O 1s, and Fe 2p3/2 regions recorded using 4.6 keV photons in 1CO:1H2 (top row) and 1CO:10H2 (bottom row) reaction gas mixtures at 2 and 2.5 Ln/min total flows correspondingly and 550 mbar pressure. Note that selected lower-temperature spectra of C 1s and Fe 2p3/2 regions are magnified by factors of 2, 3, and 5 for better visibility of the iron oxide contribution and surface carbon-containing adsorbates. Approximate locations of determined species are annotated in the figure. “TP-” and “O-carbide” stand for carbide structures with trigonal prismatic and octahedral sites occupied by carbon atoms, respectively.

