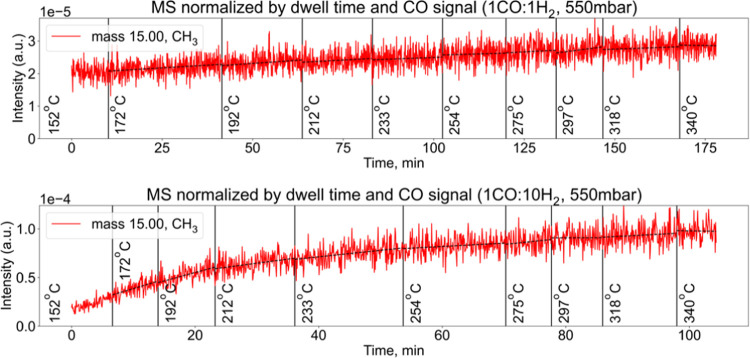
Figure 6.
Mass spectrometry signal corresponding to the sets of measurements in 1CO:1H2 (top) and 1CO:10H2 (bottom) gas mixtures at a 550 mbar pressure. The signal is normalized by the dwell time and respective CO signal to eliminate the effect of potential total pressure fluctuations and drift in the mass spectrometer. The broken lines in both panels show the linear fit of every temperature interval.

