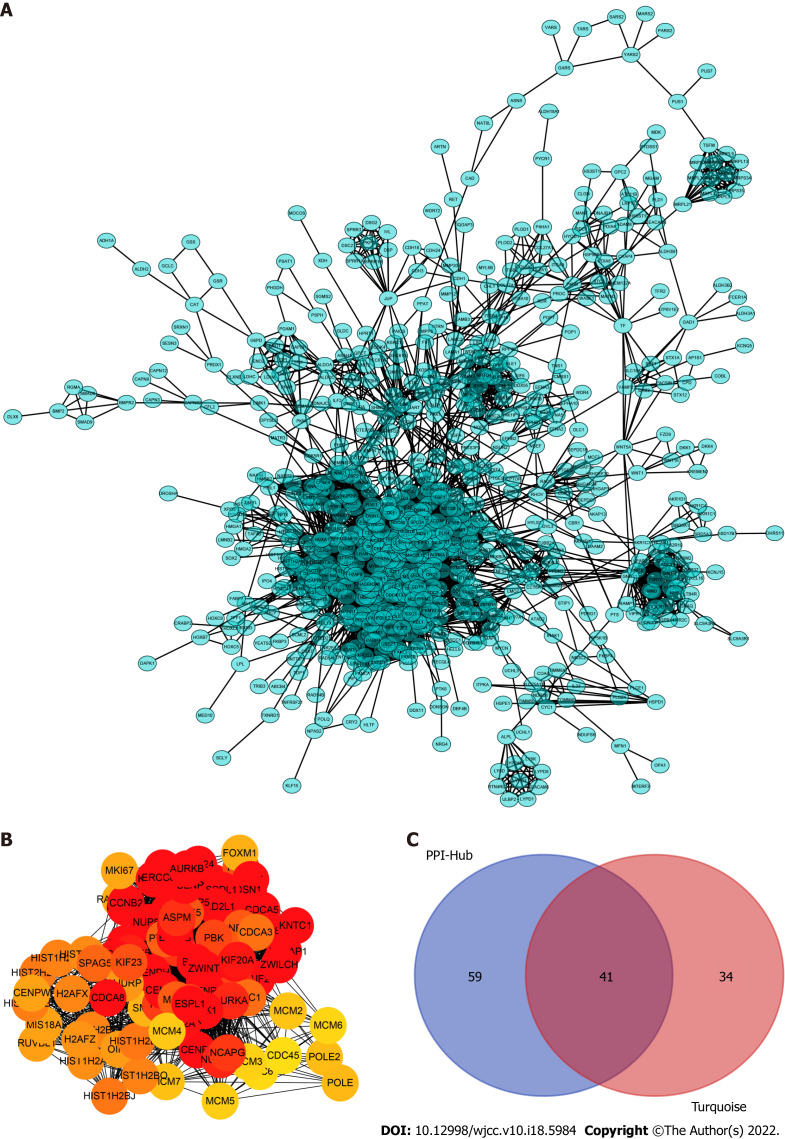
Figure 3.
Construction of the protein–protein interaction networks of turquoise module genes and the selected hub genes. A: Network of all turquoise module genes excluding the low connectivity genes; B: The cytohubba algorithm used to identify the top 100 hub genes located in the core area of the turquoise module; C: Venn diagram showing an overlap between the protein–protein interaction hub and gene signature/module membership-key genes in the turquoise module. A total of 41 real hub genes finally selected for further analyses.

