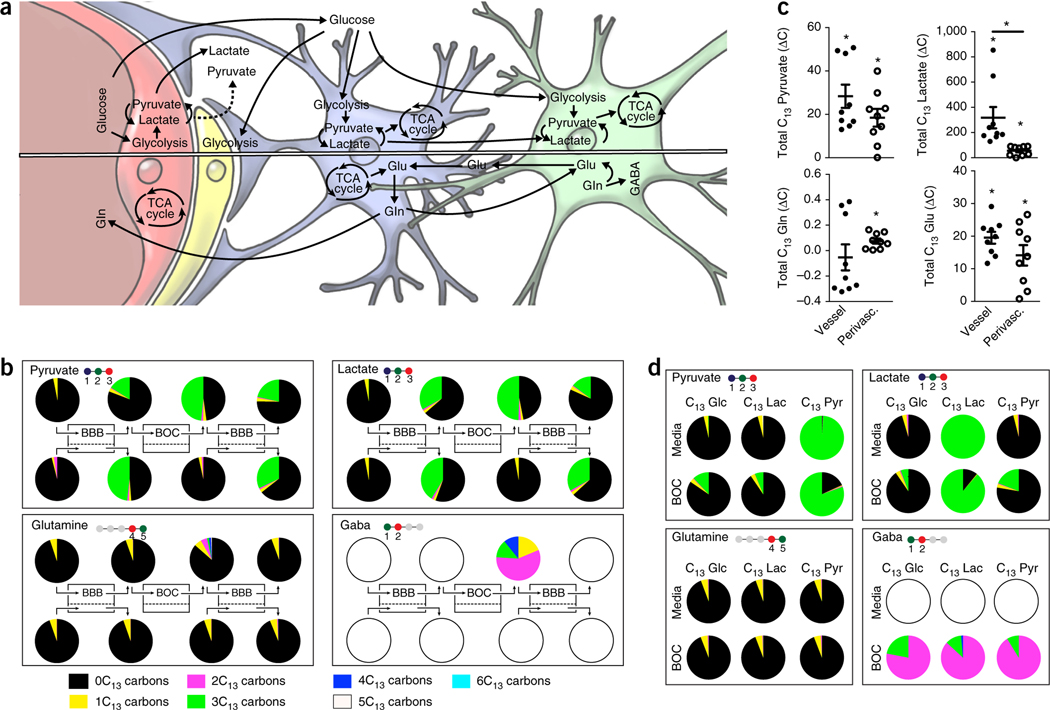
Figure 5.
Linked cell metabolism in the NVU system. (a) Simplified schematic representation of how glucose and glutamate (Glu)–glutamine (Gln) cycles are thought to interplay with all four cell types of the NVU—endothelial cells, pericytes, astrocytes and neurons. A simplified sketch of the pathways of glycolysis (TCA cycle and Glu/Gln/GABA cycles) can be found in Supplementary Fig. 11. (b) Graphic depictions of the distribution of the C13-labeled metabolites, pyruvate, lactate, glutamine and GABA measured by MS analysis when C13-labeled glucose was provided as the only glucose source in the NVU system. The number of carbons in respective compound is illustrated in the ball-and-stick molecular illustration where the colored balls show number of carbons incorporated in each glycolysis-TCA cycle turnover (i.e., pyruvate has three carbons, all of which are coming from glucose, while glutamine has five carbons, but only two coming from glucose in one cycle, see Supplementary Fig. 11). The pie charts, showing percentage of C13-labeled carbons for each analyte (i.e., 3C13 refer to molecule with three labeled carbons), are positioned above or below the sampling points along the NVU system diagrammed at the center. (c) The change in concentration of C13-labeled metabolites derived from each of the influx BBB compartments vascular (black), *P values: pyruvate = 0.0008, lactate = 0.0056, Gln = 0.6178, Glu < 0.0001 or perivascular (unfilled); *P values: pyruvate = 0.0019, lactate = 0.0021, Gln = 0.0060, Glu = 0.0020, (averages ± s.e.m., N = 3 representing independent NVU systems, with one time point, and N = 2 representing independent NVU systems with three time points), significance showed versus no change over the compartment ∆C = 0, unpaired two-tailed t-test (Supplementary Table 1a). Lactate vascular versus perivascular *P = 0.0074 unpaired t-test. (d) Isotype distribution of pyruvate, lactate, Gln and GABA in unlinked brain chips supplied with C13-labeled glucose (Glc), lactate (lac) and pyruvate (pyr), respectively.

