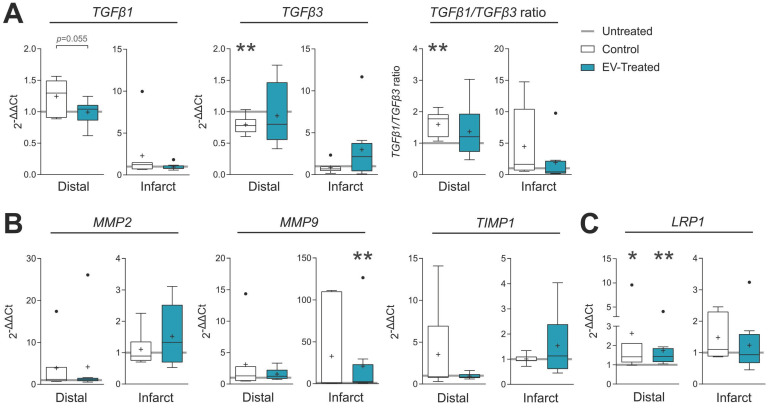
Figure 4.
Gene expression of fibrosis drivers and remodelling-related genes in the distal tissue or infarct core 30 days post-MI. Gene expression was calculated using the ΔΔCt method relative to the endogenous gene PGK1 and to the expression level of the untreated animals. Tukey boxplots with the mean shown as “+” and outliers as a point, from n = 4;7;8 animals in Untreated, Control and EV-Treated groups, respectively. Statistical significance to the Untreated group was calculated using a One-sample T-test and indicated as *p < 0.05; **p < 0.01. Differences between the Control and EV-Treated groups were calculated with a Student T-test.

