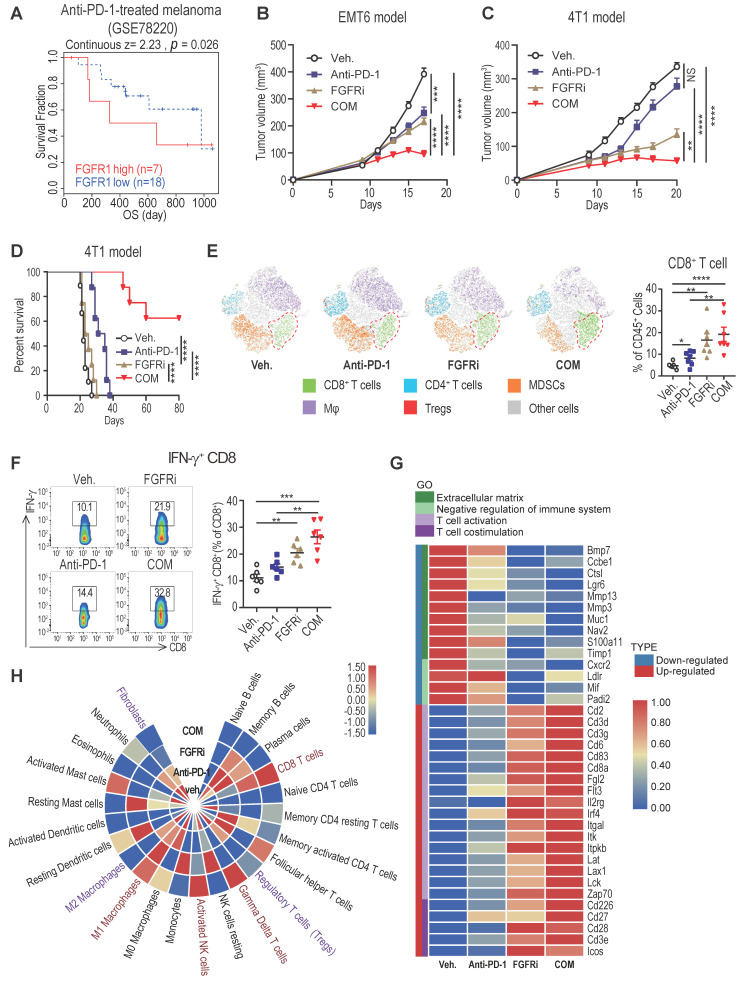
Figure 6.
FGFR blockade synergizes with immune checkpoint blockade therapy. A) Overall survival of melanoma patients who had high FGFR1 vs. low FGFR1 expressed in the tumors before anti-PD-1 treatment (GSE78220). B and C) EMT6 (B) and 4T1 (C) tumor growth in mice treated with vehicle, anti-PD-1, FGFRi (Erdafitinib) or combination of anti-PD-1 and FGFRi (n=7 mice/group, two-way ANOVA). D) Survival analysis of 4T1 tumor-bearing mice treated with indicated therapy (n=8 mice/group, log-rank test). E) The t-SNE plot of TILs and CD8+ T cell population in 4T1 tumors from mice treated with indicated therapies (n=6, one-way ANOVA). F) Percentage of IFN-γ+ CD8+ T-cells in indicated therapy-treated 4T1 tumors (n=6, one-way ANOVA). G) Gene ontology (GO) analysis by RNA-seq of 4T1 tumors in indicated groups (n=3/group). Heatmap shows the DEGs and associated signatures. COM, anti-PD-1+FGFRi. H) Heatmap shows the percentage of tumor infiltrating immune cells and fibroblasts in indicated therapy-treated 4T1 tumors.

