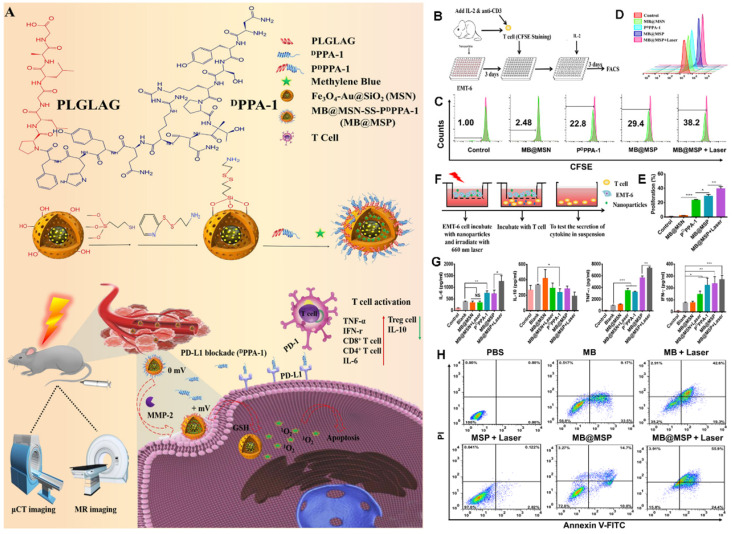
Figure 15.
(A) Schematic illustration of the therapeutic mechanism of MB@MSP for PDT and immune therapy. (B) Schematic diagram of T cells and EMT-6 tumor cells co-culture system. (C, D) The proliferation rate of T cells was assessed after various treatments by flow cytometry analysis. (E) Quantification of the proliferation rate of T cells. (F) Schematic illustration of the in vitro Transwell co-cultured system, in which EMT- 6 tumor cells were pre-treated and then incubated with T cells. Tumor cells were placed in the upper chamber, and T cells were cultured in the lower chamber. Finally, cytokine secretion by T cells cultured system, measured by ELISA (G). (H) Flow cytometry data for Annexin V-FITC/PI-stained EMT-6 cells with different treatments, the lower left, lower right, upper right, and upper left quadrants represent the viable, early apoptotic, late apoptotic, and dead cells, respectively. Adapted with permission from 97, copyright 2021 Elsevier.

