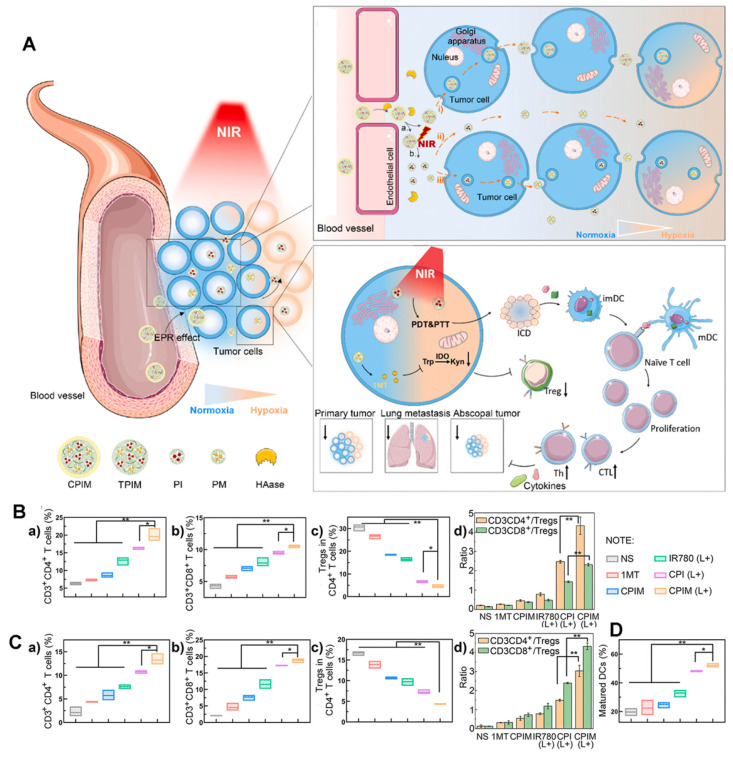
Figure 20.
(A) Schematic illustration of the in vivo performance; (B) Analysis of percentages of Ths (CD3+ CD4+), CTLs (CD3+ CD8+), Tregs (CD4+ FOXP3+) and the ratio of Ths/Tregs and CTLs/Tregs in abscopal tumors (n=3); (C) Analysis of percentages of Ths (CD3+CD4+), CTLs (CD3+ CD8+), Tregs (CD4+ FOXP3+) and the ratio of Ths/Tregs and CTLs/Tregs in spleens (n=3); (D) Analysis of percentages of matured DCs (CD80+ CD86+) in tumor-draining lymph nodes (n=3). Adapted with permission from 114, copyright 2021 Elsevier.

