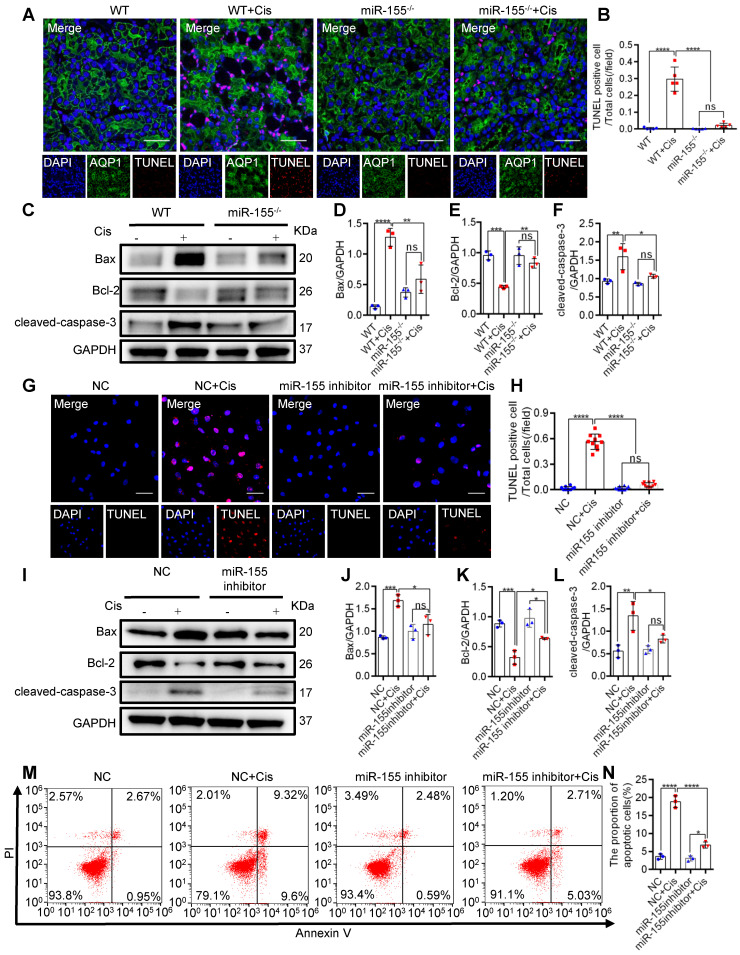
Figure 2.
MiR-155 inhibition attenuates renal tubular cells apoptosis during cAKI. (A) Representative immunofluorescence double staining of AQP1 (green, proximal tubules) and TUNEL (red) in kidney tissues and quantification of the apoptotic cells (n = 5). Scale bars, 50 µm. (B) The quantification of TUNEL+ TECs (n = 5). (C-F) Representative western blot gel documents and summarized data showing the protein levels of Bax, Bcl-2, and cleaved-caspase-3 in the kidneys of mice with cisplatin-induced AKI. (G and H) Representative images of TUNEL staining in HK-2 cells and quantification of the apoptotic cells per field (n = 10). Scale bars, 50 µm. (I-L) Representative western blot gel documents and summarized data showing the protein levels of Bax, Bcl-2, and cleaved-caspase-3 in HK-2 cells treated with cisplatin (n = 3). (M and N) Flow cytometry analysis of annexin V/PI staining and quantification of the apoptotic cells (n = 3). Data are presented as mean ± SD, * p < 0.05, ** p < 0.01, *** p < 0.001, **** p < 0.0001.

