Fig. 4.
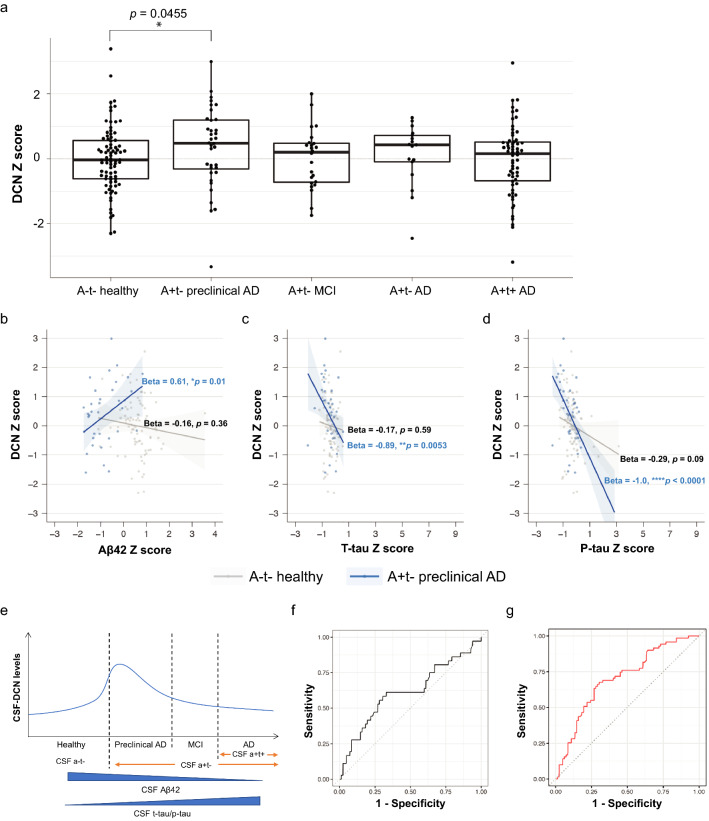
CSF-decorin positively correlates with CSF-Aβ42 in a + t− preclinical AD and predicts a subtype of AD. a CSF-DCN levels in a-t- healthy (n = 82) and a + t− subjects with preclinical AD (n = 36), MCI (n = 24), AD (n = 17), and a + t + AD (n = 62). (*p < 0.05 as compared to a-t- healthy). b Correlations of CSF-DCN and CSF-Aβ42, c CSF-DCN and CSF-t-tau, d CSF-DCN and CSF-p-tau in a-t− healthy and a + t− preclinical AD subjects. The regression coefficients (Beta) and p-values are displayed. (*p < 0.05, **p < 0.01, ****p < 0.0001). e Hypothetical curve showing CSF-DCN alteration from a-t− healthy subjects to a + t− preclinical AD, MCI, AD and a + t + AD subjects and its correlation with CSF-Aβ42 and CSF-tau levels. f Receiver operating characteristic (ROC) analysis was performed in a + t- preclinical AD (n = 36) versus healthy control (n = 82) and revealed an area under the ROC Curve (AUC) (95% confidence interval (CI)) = 0.61 (0.50, 0.73) (p = 0.058) for CSF-DCN levels. g ROC curve was performed in a subtype classified by as innate immune activation (n = 71) versus healthy control (n = 82) and revealed an AUC (95% CI) = 0.70 (0.62, 0.79) (p = 1.73 × 10⁻⁶) for CSF-DCN levels. Data in (a) were analyzed by one-way ANOVA followed by Tukey’s multiple comparisons test. Data are represented as mean ± SEM. DCN: decorin

