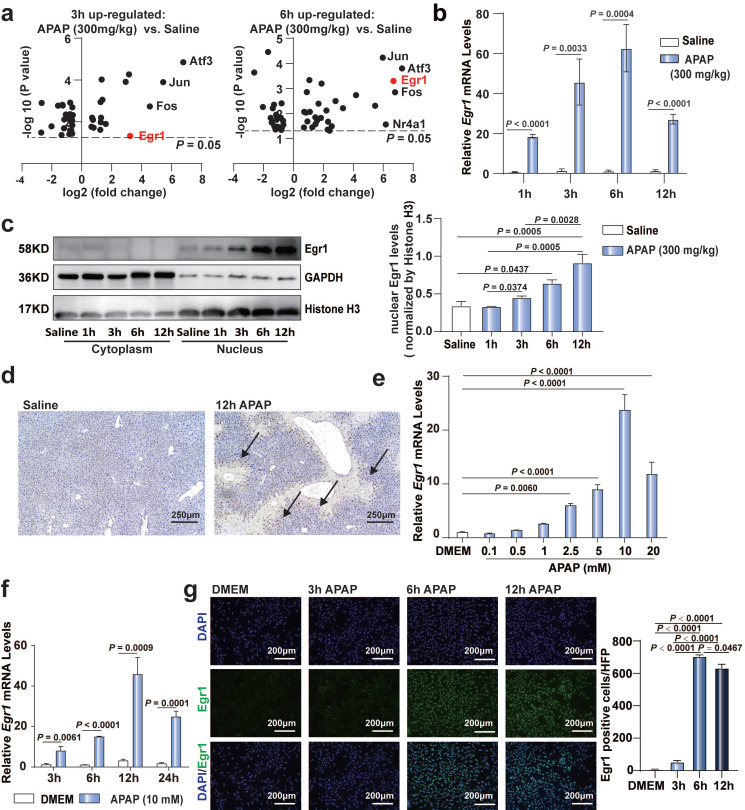
Fig 1.
Egr1 was significantly upregulated in acute AILI models. a. Volcano plots of transcriptional factors from liver tissue RNA sequencing data of saline group, 3 h AILI group and 6 h AILI group (P < 0.05, n = 3 mice/group, t test). b. Relative Egr1 mRNA levels of liver tissue in saline and APAP groups at 1, 3, 6, and 12 h (n = 6 mice/group, t test). c. Western blot analysis of Egr1 levels of cytoplasmic and nuclear protein in the liver tissue of saline and APAP groups at 1, 3, 6, and 12 h, followed by quantified protein levels (one-way ANOVA). d. Immunohistochemical staining images of Egr1 in the liver tissue of saline group and 300 mg/kg APAP groups at 12h (scale bar = 250 μm). Black arrows represent positive staining. e. Relative Egr1 mRNA levels of PMHs treated with different doses of APAP (one-way ANOVA). f. Relative Egr1 mRNA levels of PMHs treated with DMEM and 10 mM APAP at different time points (t test). g. Representative images of Egr1 fluorescence in PMHs treated with 10 mM APAP for 0, 3, 6, and 12 h (scale bar = 200 μm), followed by quantified the numbers of Egr1 positive cells per high-power field (HPF) (one-way ANOVA).

