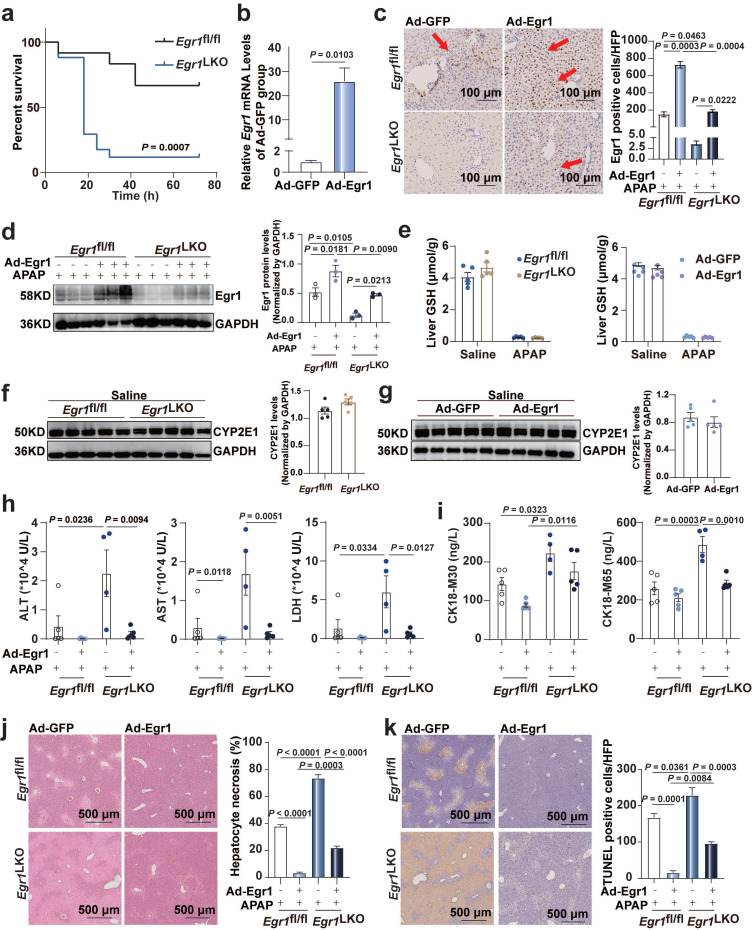
Fig 2.
Egr1 overexpression ameliorated acute AILI. Egr1fl/fl and Egr1LKO mice were injected with Ad-Egr1 or Ad-GFP via tail vein prior to 300 mg/kg APAP administration. After 12 h, liver and serum samples were collected. a. The survival rate analysis in Egr1fl/fl and Egr1LKO mice after 750 mg/kg APAP treatment (n = 12 mice/Egr1fl/fl group, n = 17 mice/Egr1LKO group, Log-rank (Mantel-Cox) test). b. Relative Egr1 mRNA levels in Ad-Egr1 or Ad-GFP pretreated mice (n = 3 mice/group, t test). c. Immunohistochemical staining images of Egr1 in the liver tissue of Ad-Egr1 or Ad-GFP pretreated AILI Egr1fl/fl and Egr1LKO mice (scale bar = 100 μm), followed by quantified the numbers of Egr1 positive cells per HPF (n = 3 mice/group, one-way ANOVA). Red arrows represent positive staining. d. Western blot analysis of Egr1 levels of total protein in the liver tissues of Ad-Egr1 or Ad-GFP pretreated AILI Egr1fl/fl and Egr1LKO mice, followed by quantified protein levels (n = 3 mice/group, one-way ANOVA). e. Hepatic GSH levels in Egr1fl/fl and Egr1LKO mice after challenge with saline and APAP for 2 h (n = 5 mice/group, t test), and in Ad-Egr1 or Ad-GFP pretreated mice after challenge with saline and APAP for 2 h (n = 5 mice/group, t test). f. Western blot analysis of CYP2E1 levels in the liver tissues of Egr1fl/fl and Egr1LKO mice after injection with saline for 2 h, followed by quantified protein levels (n = 5 mice/group, t test). g. Western blot analysis of CYP2E1 levels in the liver tissues of Ad-Egr1 and Ad-GFP mice after injection with saline for 2 h, followed by quantified protein levels (n = 5 mice/group, t test). h. Serum ALT, AST, and LDH levels in Ad-Egr1 or Ad-GFP pretreated AILI Egr1fl/fl and Egr1LKO mice were measured (n = 4-5 mice/group, one-way ANOVA). i. Serum CK18-M30 and CK18-M65 levels in Ad-Egr1 or Ad-GFP pretreated Egr1fl/fl and Egr1LKO AILI mice were measured (n = 4-5 mice/group, one-way ANOVA). j. Liver sample obtained from Ad-Egr1 or Ad-GFP pretreated Egr1fl/fl and Egr1LKO AILI mice were stained with H&E, followed by quantified the area of hepatocyte necrosis (scale bars = 500 μm, one-way ANOVA). k. Liver sample obtained from Ad-Egr1 or Ad-GFP pretreated AILI Egr1fl/fl and Egr1LKO mice were stained with TUNEL, followed by quantified the numbers of TUNEL positive cells per HFP (scale bars = 500 μm, one-way ANOVA).

