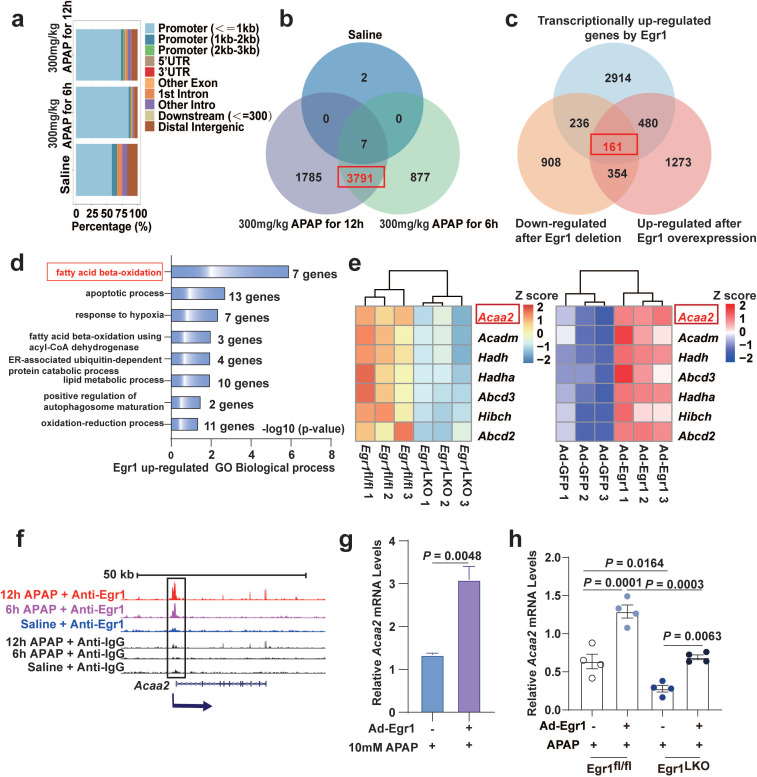
Fig 3.
Genome-wide analysis of Egr1 binding sites and analysis of Egr1 induced transcriptomic changes in APAP-injured mouse liver. Mice were treated with saline, 300 mg/kg APAP for 6 h and 12 h APAP, and liver samples were collected for ChIP-seq. Egr1fl/fl and Egr1LKO mice were injected with 300 mg/kg APAP for 12 h, and liver samples were collected for RNA-seq. Egr1LKO mice were pretreated with Ad-Egr1 or Ad-GFP prior to challenge with 300 mg/kg APAP, after 12 h the liver samples were collected for RNA-seq. a. Bar-plot showed genomic distribution of peaks. b. Venn diagram showing the corresponding numbers of Egr1-bound genes analyzed from ChIP-seq. c. Venn diagram showed the distinct genes that were transcriptionally regulated by Egr1, down-regulated by Egr1 deletion, up-regulated by Egr1 overexpression (fold change ≥ 1.5, P < 0.05, t test). d. Significantly enriched biological process categories in the GO analysis concerning the 161 transcriptionally upregulated genes. e. Heatmaps representing the Z score changes of genes in FAO between Egr1fl/fl AILI mice and Egr1LKO AILI mice, and Z score changes of genes in FAO between Ad-Egr1 or Ad-GFP pretreated AILI mice (n = 3 mice/group, fold change ≥ 1.5, P < 0.05, t test). f. Genome-browser screenshots of Acaa2 occupancy at Egr1 gene loci. g. Relative Acaa2 mRNA levels in AML12 cells of Ad-Egr1 or Ad-GFP group after 10mM APAP challenge for 6 h (t test). h. Relative Acaa2 mRNA levels in Egr1fl/fl and Egr1LKO mice of Ad-Egr1 or Ad-GFP group after 300mg/kg APAP challenge for 12 h (n = 4 mice/group, one-way ANOVA).

