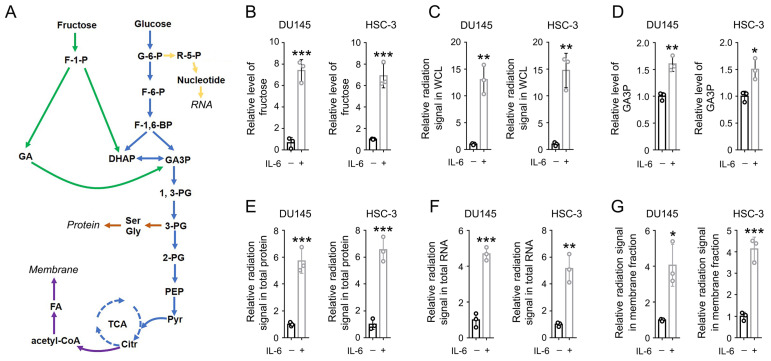
Figure 1.
IL-6 activates both the uptake and utilization of fructose. (A) A schematic of fructose metabolism. Distinct metabolic pathways are shown with arrows in different colors: glycolysis and TCA cycle in blue, fructolysis pathway in green, nucleotide and RNA synthesis in yellow, fatty acid and membrane biosynthesis in purple, and amino acids and protein biosynthesis in brown. (B, D) DU145 and HSC-3 cells were stimulated with IL-6 (50 ng/mL) for 24 h, and the level of cellular fructose (B) and GA3P (D) was measured. Data represent the mean and SD from three independent experiments. *P < 0.05; **P < 0.01; ***P < 0.001. (C, E-G) DU145 and HSC-3 cells were stimulated with IL-6 (50 ng/mL) for 24 h, and then incubated with 10 µCi [14C]-fructose for 30 min (C) or 1 h (E-G). The level of radiation signal in whole cell lysate (B), total protein (E), total RNA (F) or cell membrane fraction (G) was measured. Data represent the mean and SD from three independent experiments. *P < 0.05; **P < 0.01; ***P < 0.001.

