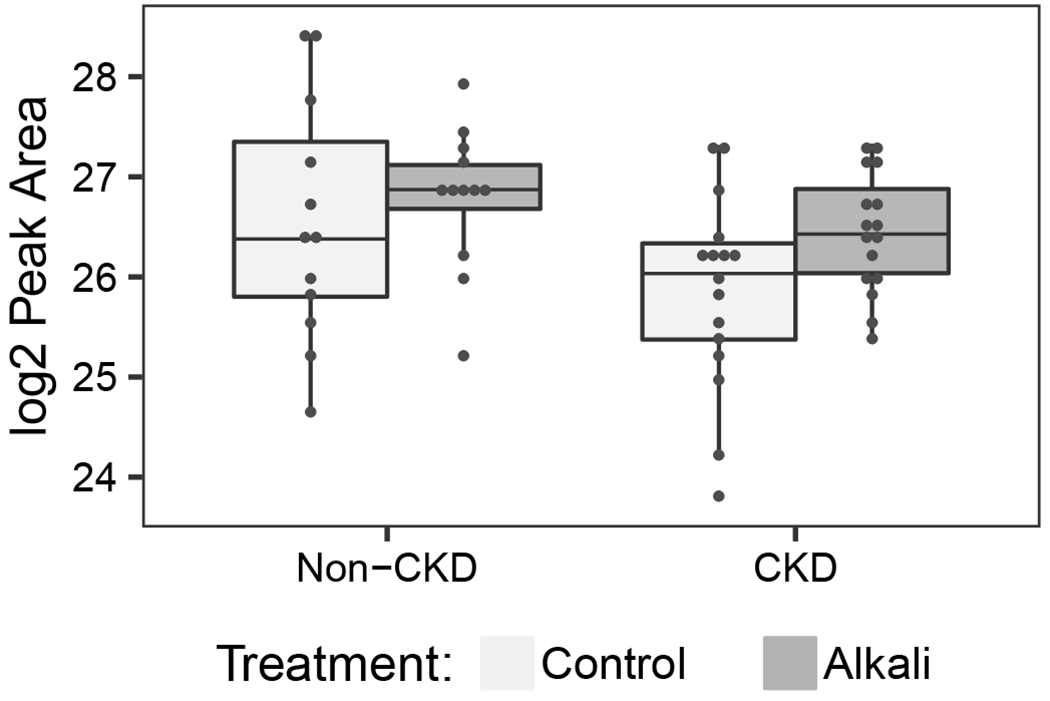
Figure 3. Levels of selected metabolites impacted by alkali depicted by study period and CKD status in the ABC Study.


Metabolites supported by both linear mixed models and sparse partial least squares discriminant analysis are presented. Scatterplots with overlying boxplots reveal log2 peak areas according to alkali and control periods in CKD and non-CKD for each of the following: (A) 24-hour urine 3-indoleacetate; (B) 24-hour urine citrate/isocitrate; (C) 24-hour urine glutarate. These metabolites were present in each sample tested and did not require imputation.
