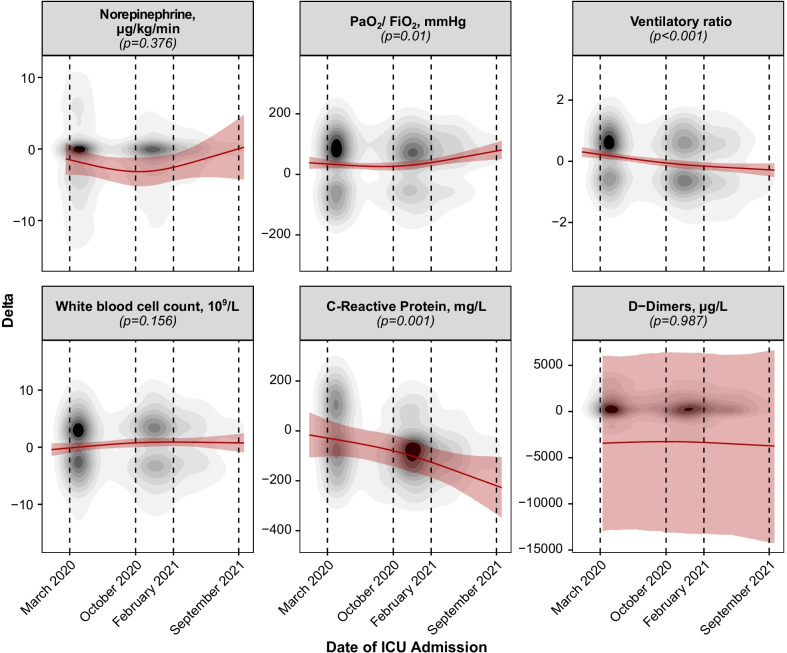
Fig. 3.
Dynamics of the evolution of vital and laboratory parameters during the first 5 days of intensive care unit stay. To capture the changes in the dynamics of disease over the first days of intensive care unit stay, the difference of a variable between day 5 and day 1 is summarized as parameter (Delta) over time. Mean effects over the time course of the pandemic, calculated by means of generalized mixed-effect models, are depicted by a red continuous line. 95% confidence intervals of the effect are depicted as shaded red area. The given p values originate from an analysis of deviance. Variables are represented by topographic density plots, in which the intensity of the grayscale colouring indicates the highest concentration of values

