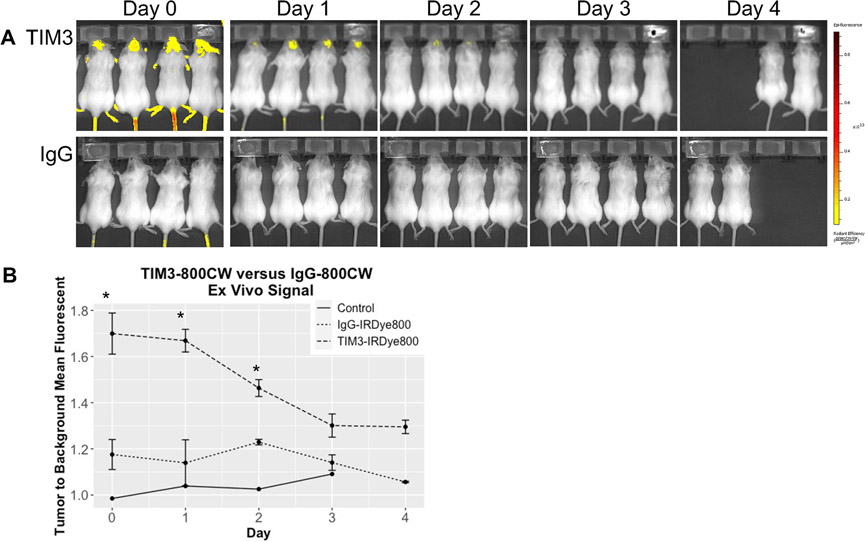
Figure 2.
(a) Interval IVIS Spectrum images obtained at excitation and emission of 745 and 800 nm, small binning, f-stop 2, and 3 seconds of exposure. (b) Line graph of fluorescent signal in vivo for mice injected with TIM3-800CW and IgG-800CW conjugate. Mean fluorescent signal was measured by ratio of the brain tumor region of interest and normal tissue. *p < 0.05

