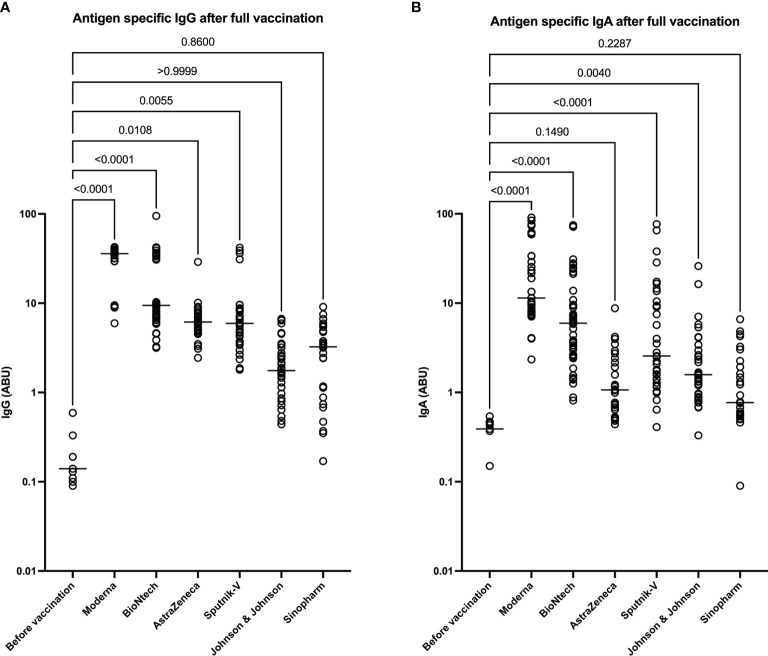
Figure 2.
Higher expression of SARS-CoV-2 reactive IgG and IgA after immunization mRNA vaccines. Graphs represent the expression SARS-CoV-2 spike-protein binding IgG (A) and IgA (B) in arbitrary binding units (ABU). Each symbol represents individual donors. Indicated p values were calculated using the Kruskal-Wallis test followed by Dunnett’s post hoc to compare each group to the controls before vaccination. Bars represent the median antibody expression in each group. Significance is accepted if p <0.05.

