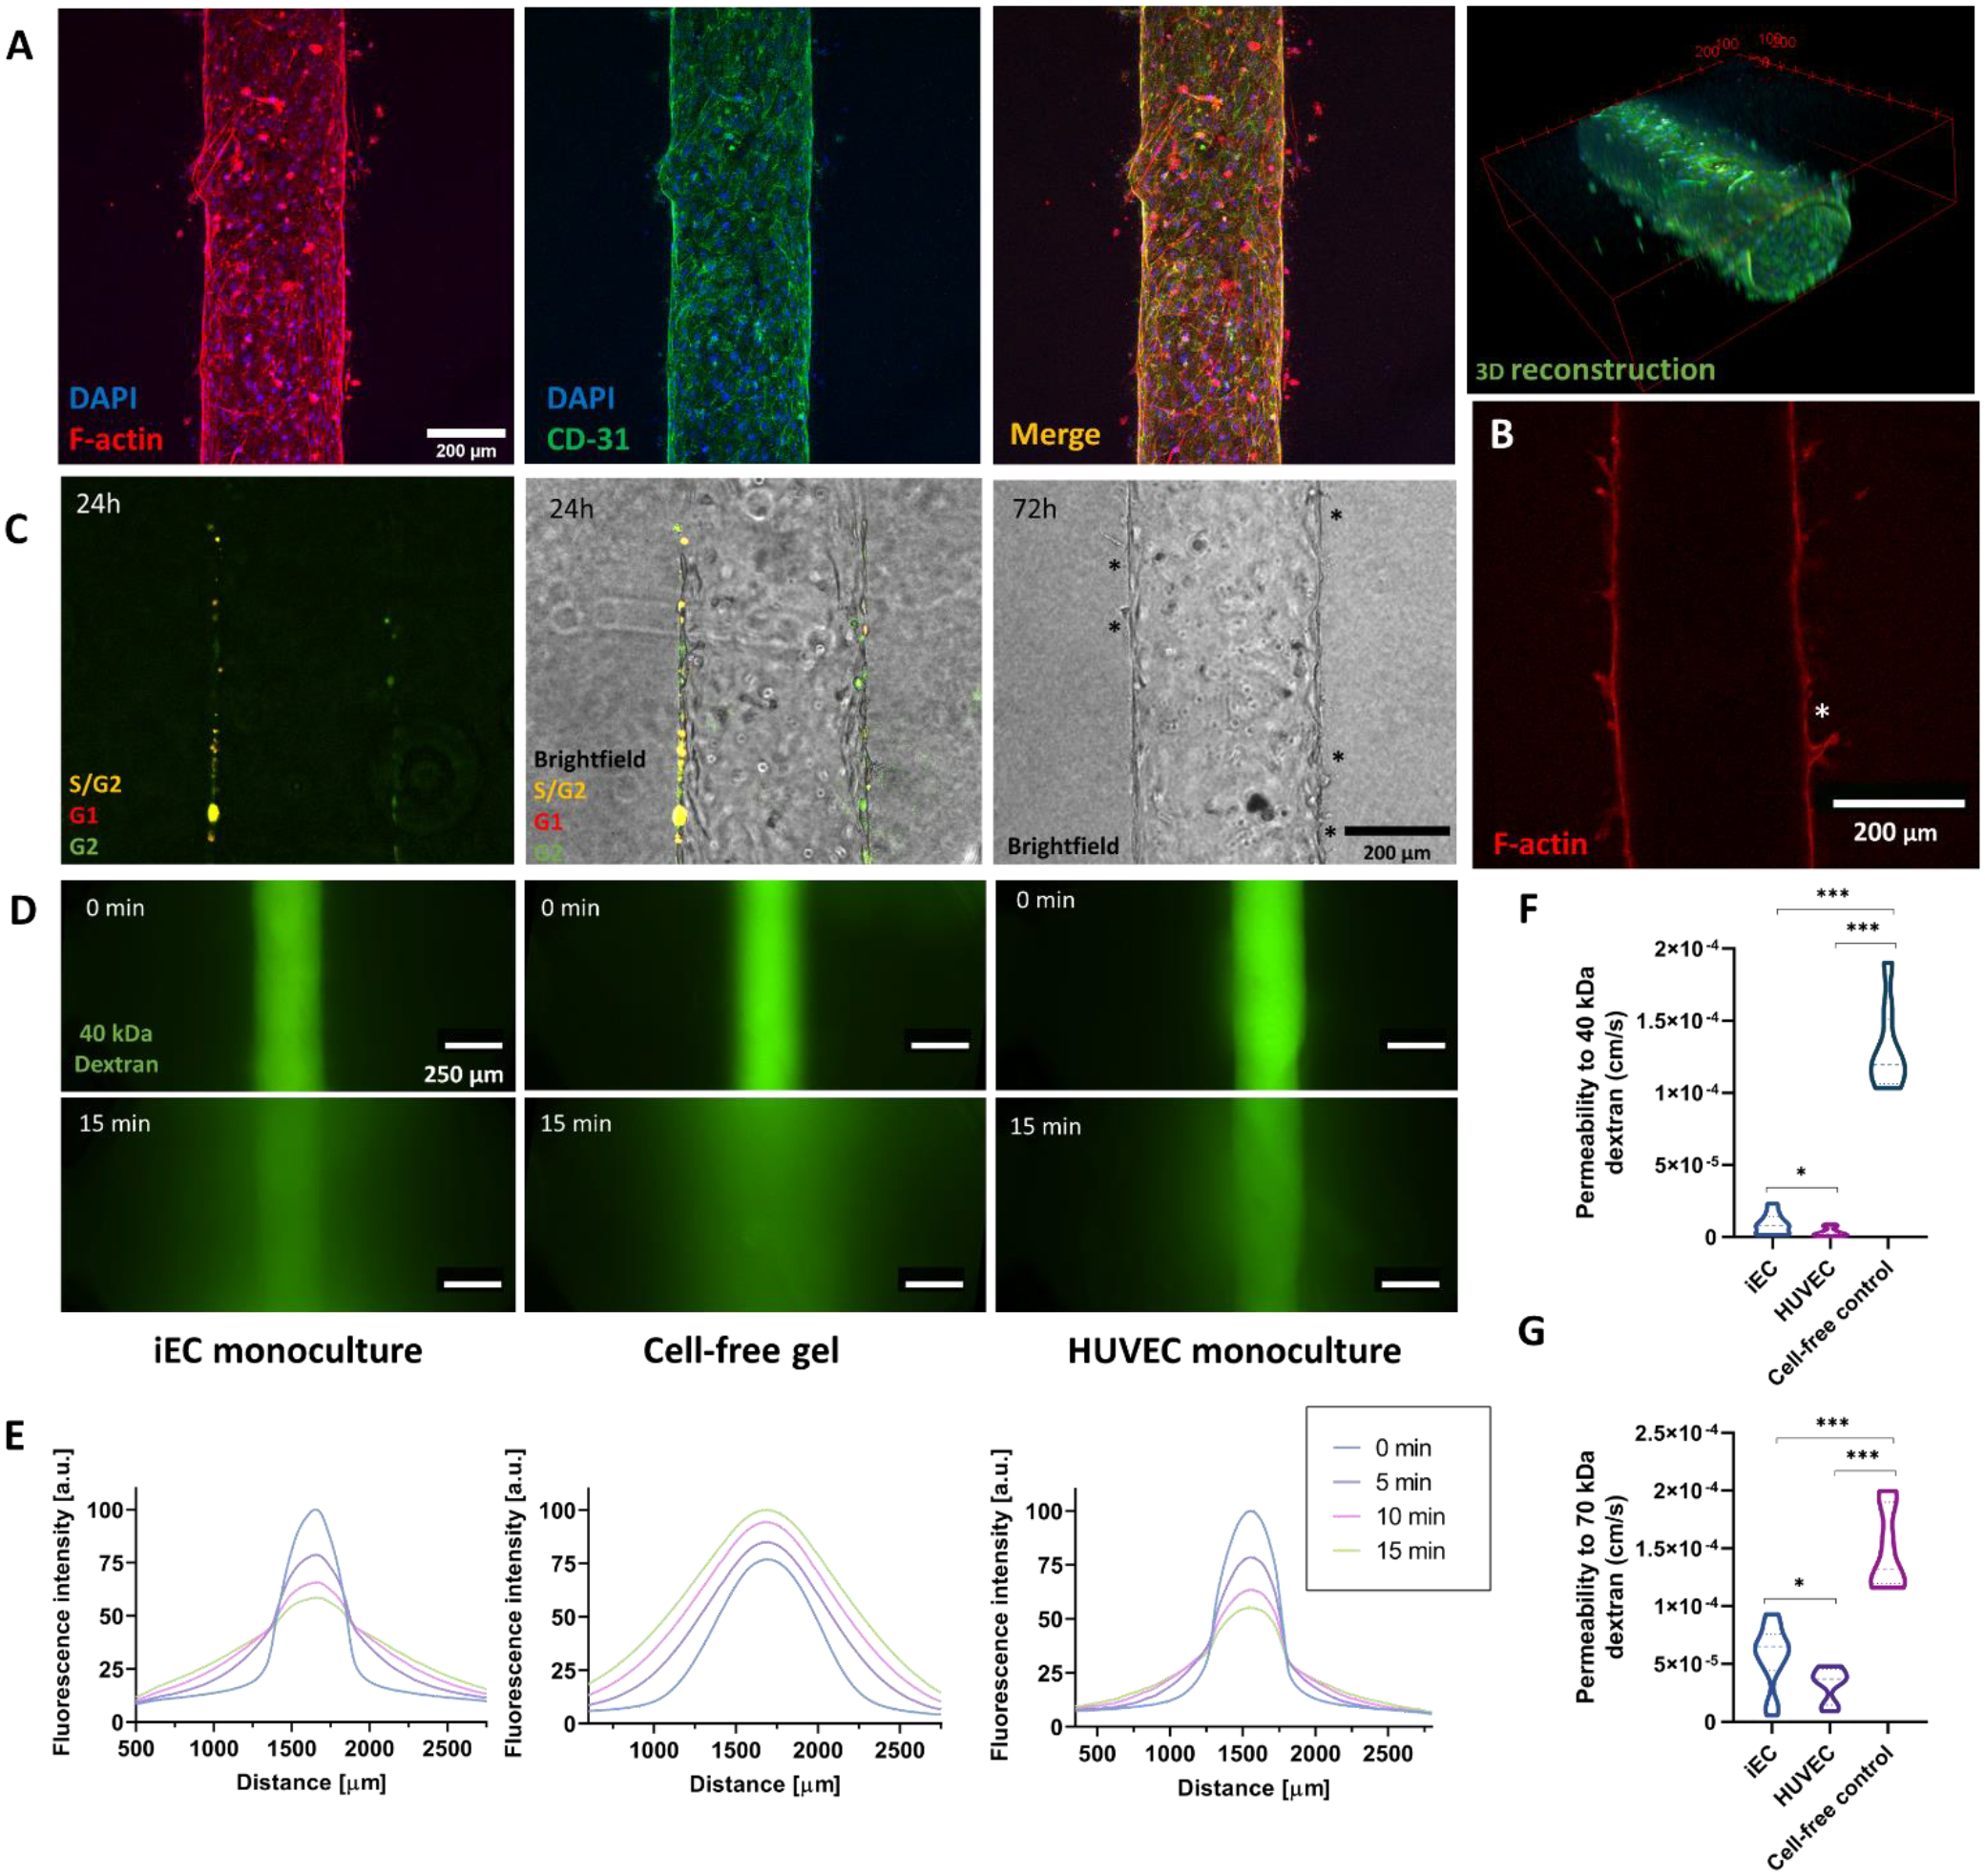
Figure 2: iPSC-EC (iEC) endothelial vessel model establishment and characterization.

A) iEC lumen stained with F-actin, CD31, and DAPI. 3D reconstruction of the tubular lumen using the CD31 staining. B) Cross-section of an iEC lumen stained with F-actin. The asterisk highlights a hollow sprout. C) Proliferation occurs within 24 – 72h in the lumen close to sprouting events (depicted with black asterisks). D) iEC vessel barrier function assessment via 40 kDa-FITC diffusion assays through the lumen compared to cell-free tubular structures (cell-free gel) and HUVEC vessels. Images are taken every 5 min for 15 min. E) Fluorescence plot profiles at 0 and 15 min are shown for each condition. F) Permeability coefficient comparison for 40 kDa and G) 70 kDa dextran. N ≥ 4 replicates per experiment from ≥ 3 independent experiments. Bars represent average ± S.E.M. *p < 0.05; **p < 0.01; ***p<0.001.
