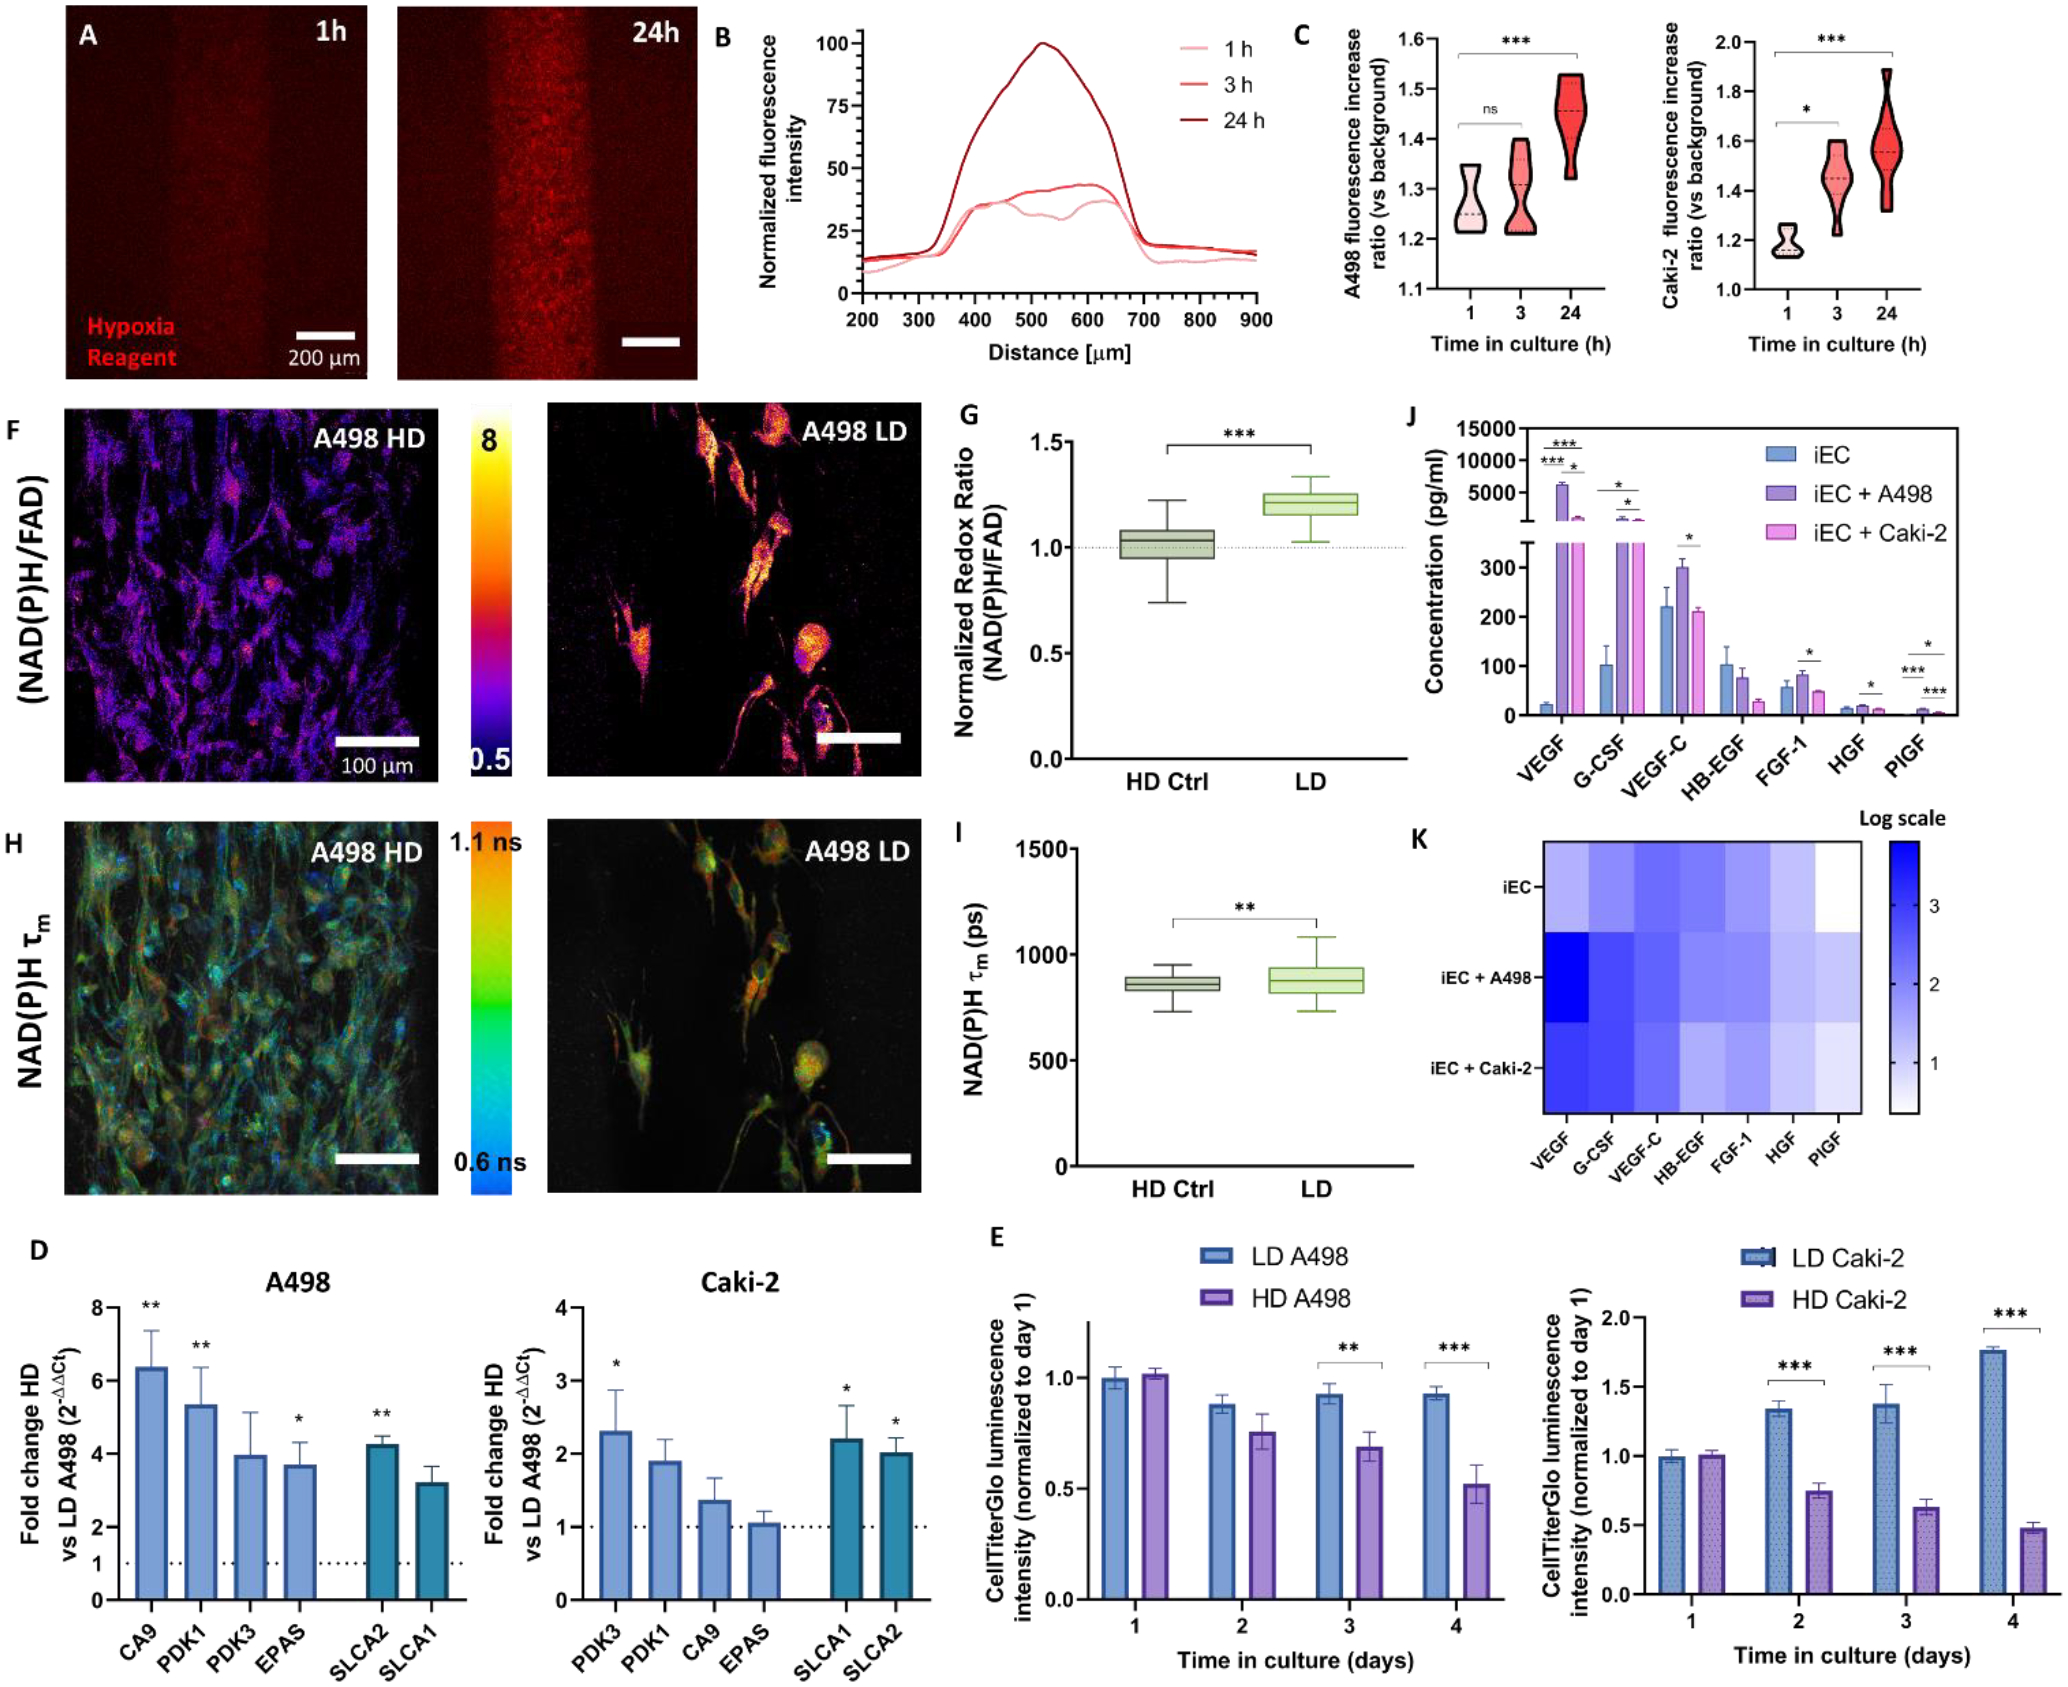
Figure 3: Establishment and characterization of the ccRCC epithelial tumor portion of the co-culture model.

A) Projected Z-stack of images of the hypoxia dye of the HD (high density) A498 model in real-time. The fluorescence of the dye is inversely proportional to the oxygen tension. B) Line profile representation of the hypoxic response of the A498 tumor model within the first 24h. C) Quantification of the hypoxia dye intensity over time for A498 (left) and Caki-2 (right). D) Representative redox ratio images of A498 resulting from an increase in A498 density (HD vs LD) and E) Tukey box plot of redox ratio normalized to HD control condition. F) Representative NAD(P)H mean fluorescence lifetime (τm) images. Scalebar = 100 μm. G) Tukey box plot of τm quantification. H) Bead-based ELISA panel of secreted pro-angiogenic factors by the iEC monoculture model compared to A498 and Caki-2 co-culture models. ANOVA + Tukey test was used to determine significance. I) Results from (F) shown as a logarithmic scale heatmap for improved visualization. J) ATP levels of LD and HD of A498 (left) and Caki-2 (right) tumor models over 4 days. K) Gene expression changes in the HD A498 (left) and Caki-2 (right) tumor models compared to the LD. Genes are grouped left to right in metabolism (blue) and glucose transporters (cyan). I-J) N ≥ 4 replicates per experiment from ≥ 3 independent experiments. Paired t-tests were used to determine significance in D-E. Kruskal-Wallis and post-hoc Dunn tests were used to determine significance in C, G, and I. Bars represent average ± S.E.M. *p < 0.05; **p < 0.01; ***p<0.001.
