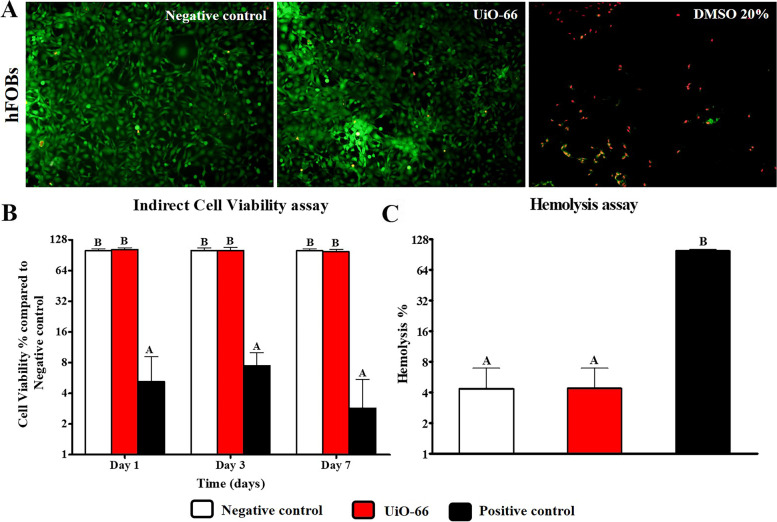
Fig. 2.
In vitro assessment of UiO-66 biocompatibility. A Cell viability using Live/Dead assay for hFOBs seeded on UiO-66 nanomaterial for 7 days. Green cells represent live cells and red color indicates dead cells (Scale = 100 µm, Magnification = 10x). B MTT cytotoxicity assay for viability evaluation of hFOB cells cultured using extracts of UiO-66 material for 1, 3, and 7 days compared to the negative control. Error bars represent means ± SD (n = 8). C Hemolysis assay using extracts of UiO-66 nanomaterial compared to the negative control. Error bars represent means ± SD (n = 3). Bars with the same letter represent insignificance values (one-way ANOVA followed by Tukey's HSD post hoc test)

