
Fig. 3.
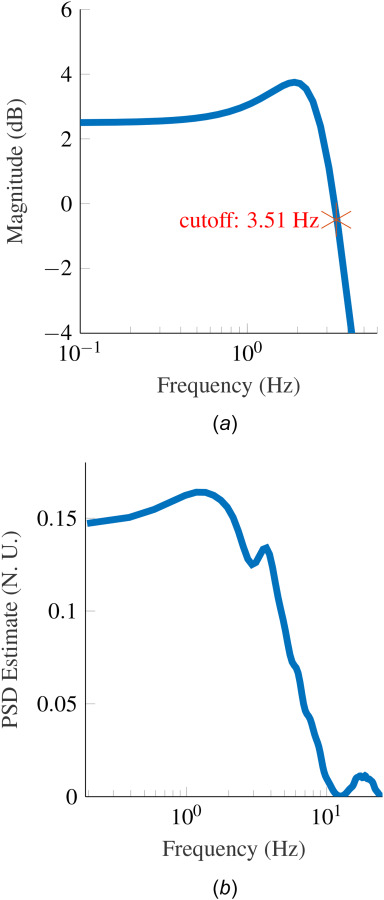
(a) Bode plot of combined admittance control and approximated arm dynamics with the highest bandwidth. The transfer function used for the approximation is described in Appendix A. (b) Power spectral density of PRBS perturbation signal that confirms the frequency content in the band of interest (0.15–10 Hz).