
Fig. 2.
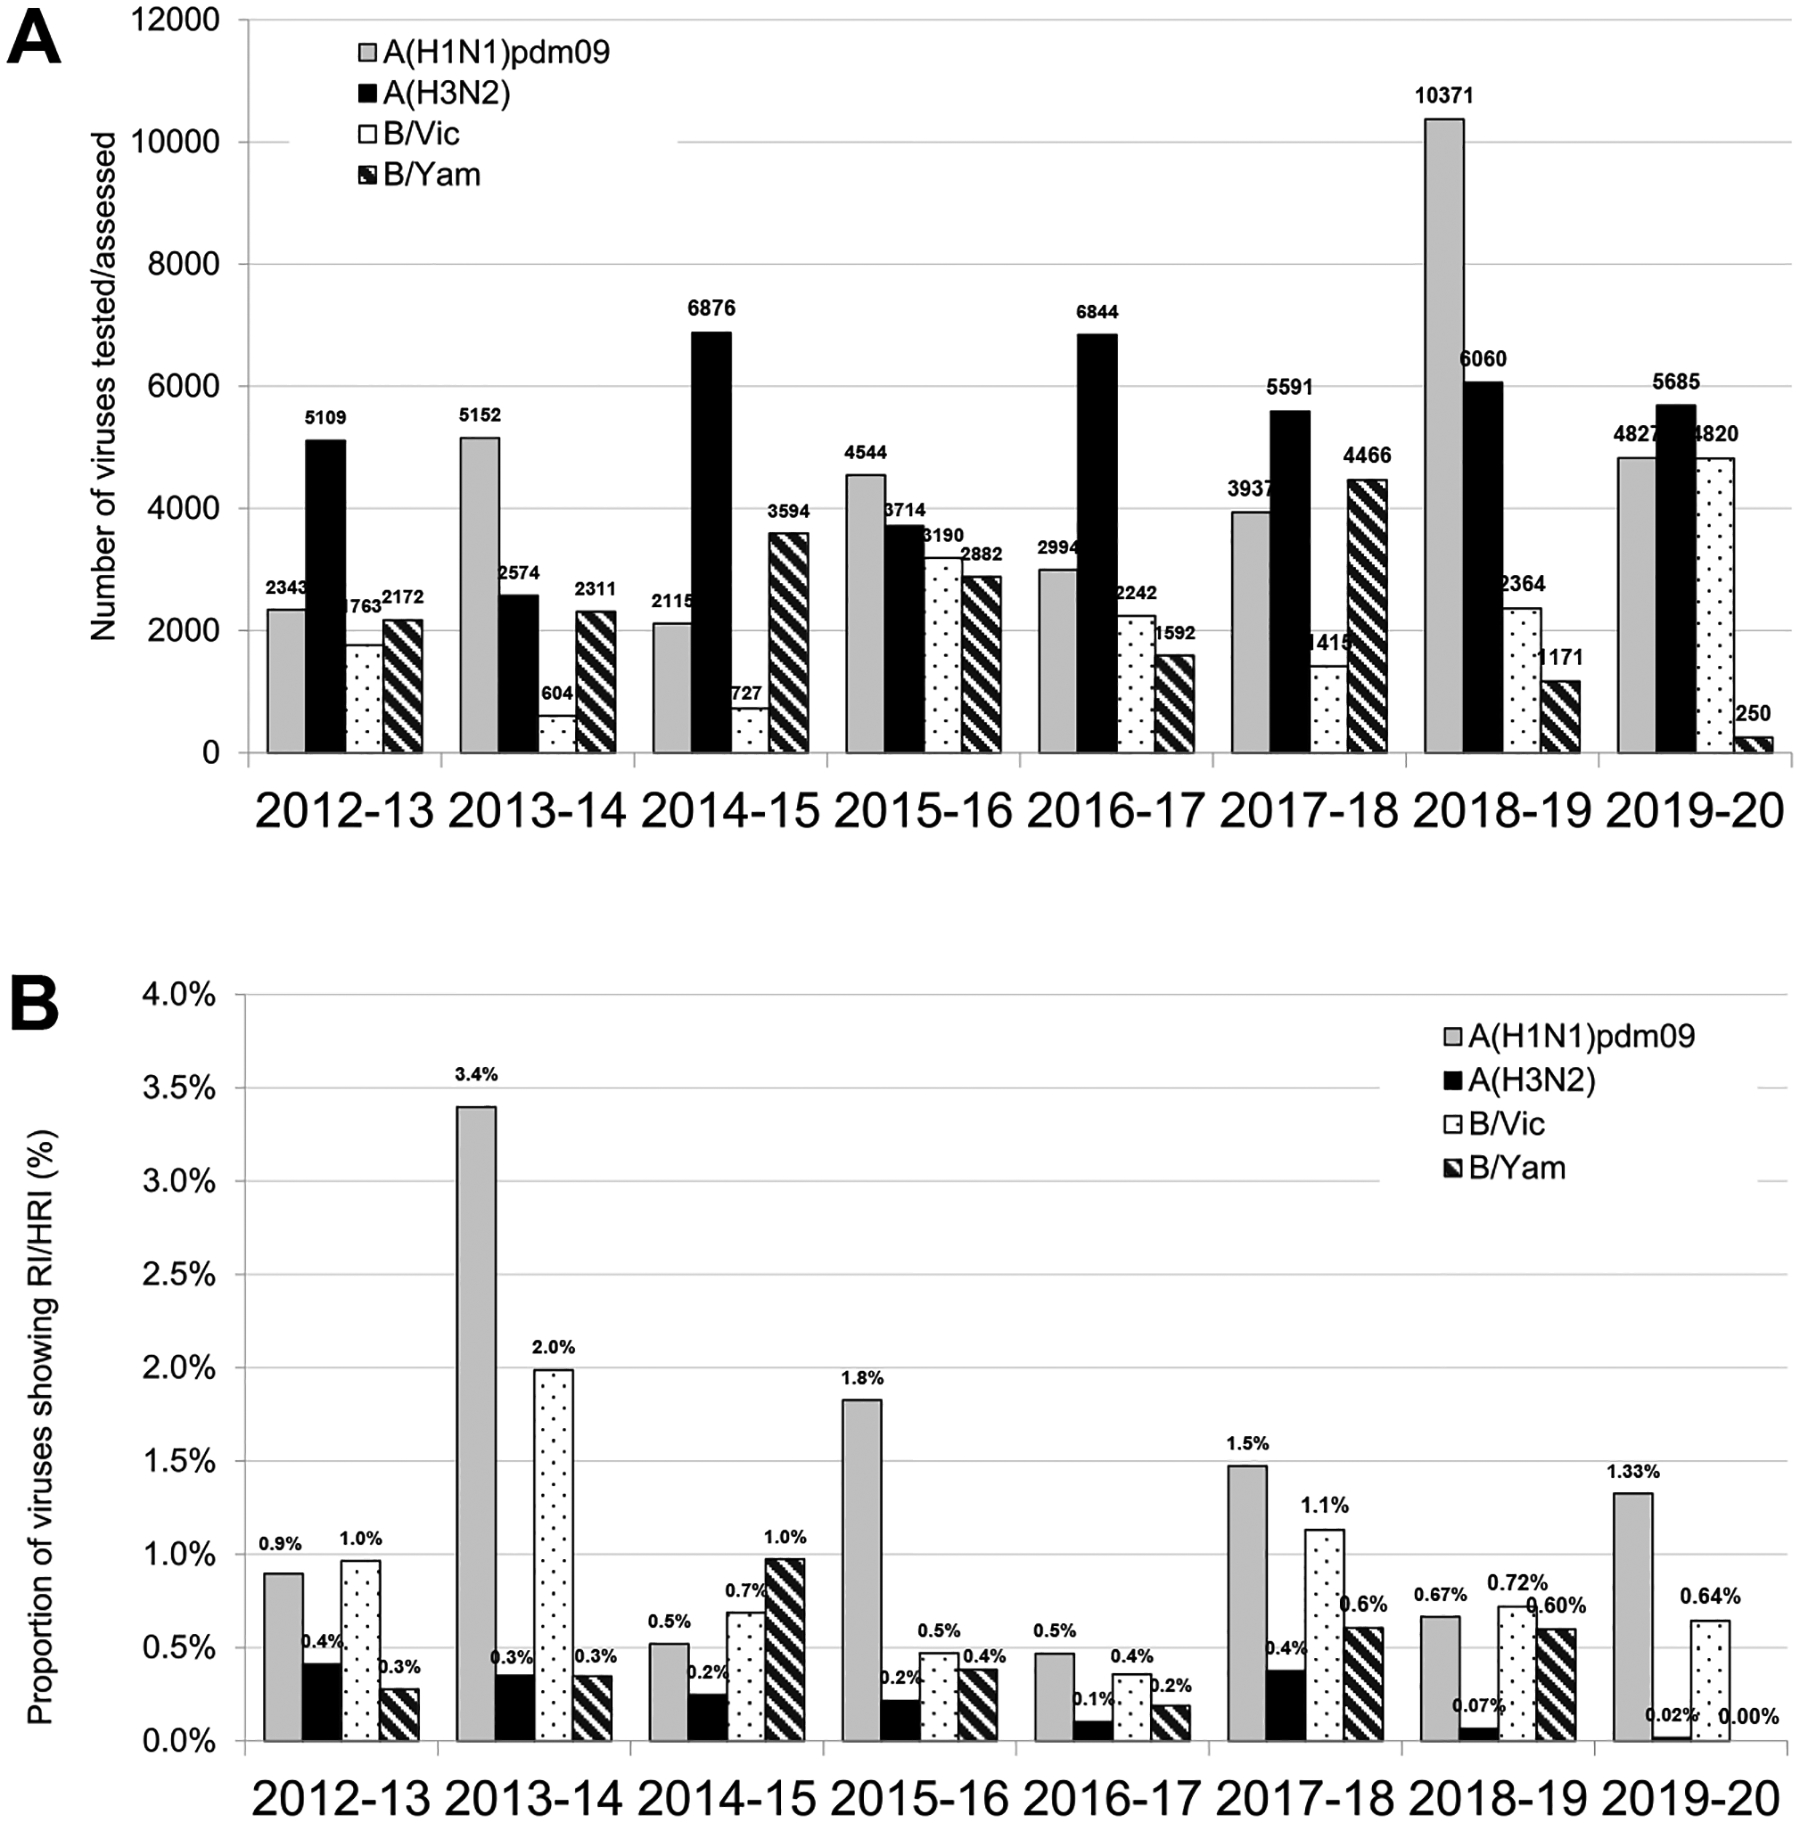
Comparison of NAI susceptibility surveillance over eight periods. (A) Number of viruses tested. For the 2012–2018 period testing was reported based on NA inhibition assays only. For the 2018–2020 period results of assessment by NA inhibition assays and/or sequence-based analysis were included. (B) The proportion of viruses showing RI/HRI by NAIs over the 2012–2020 period. Data were compiled from the global studies of viruses isolated during the 2012–2013 (Meijer et al., 2014), 2013–2014 (Takashita et al., 2015a, 2015b), 2014–2015 (Hurt et al., 2016), 2015–2016 (Gubareva et al., 2017), 2016–2017 (Lackenby et al., 2018), 2017–2018 (Takashita et al., 2020a), and 2018–2020 (current study) periods.