
Fig. 3.
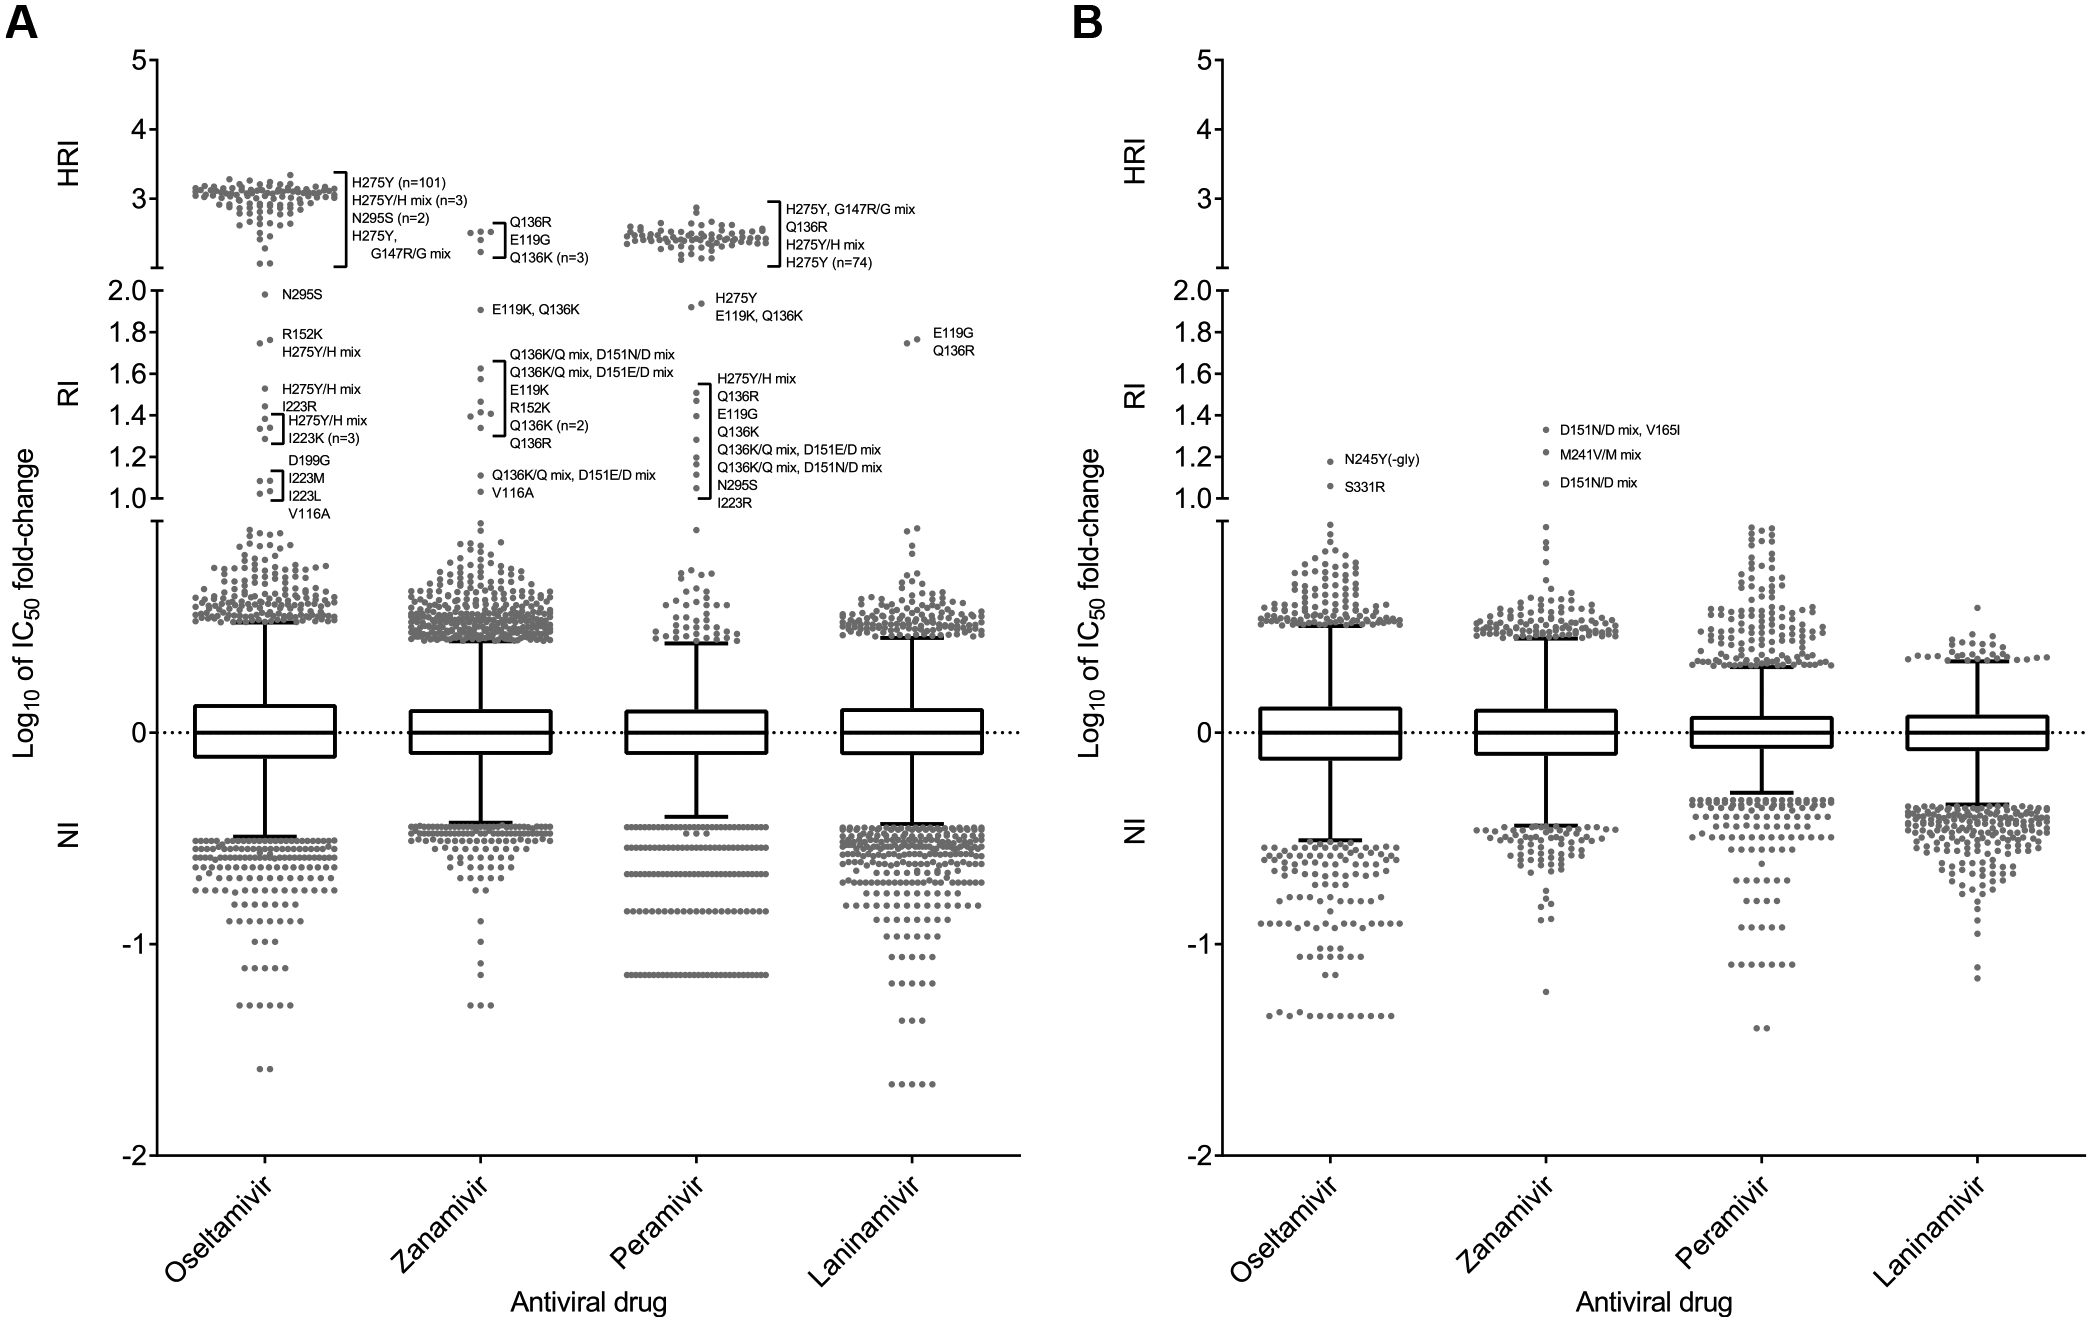
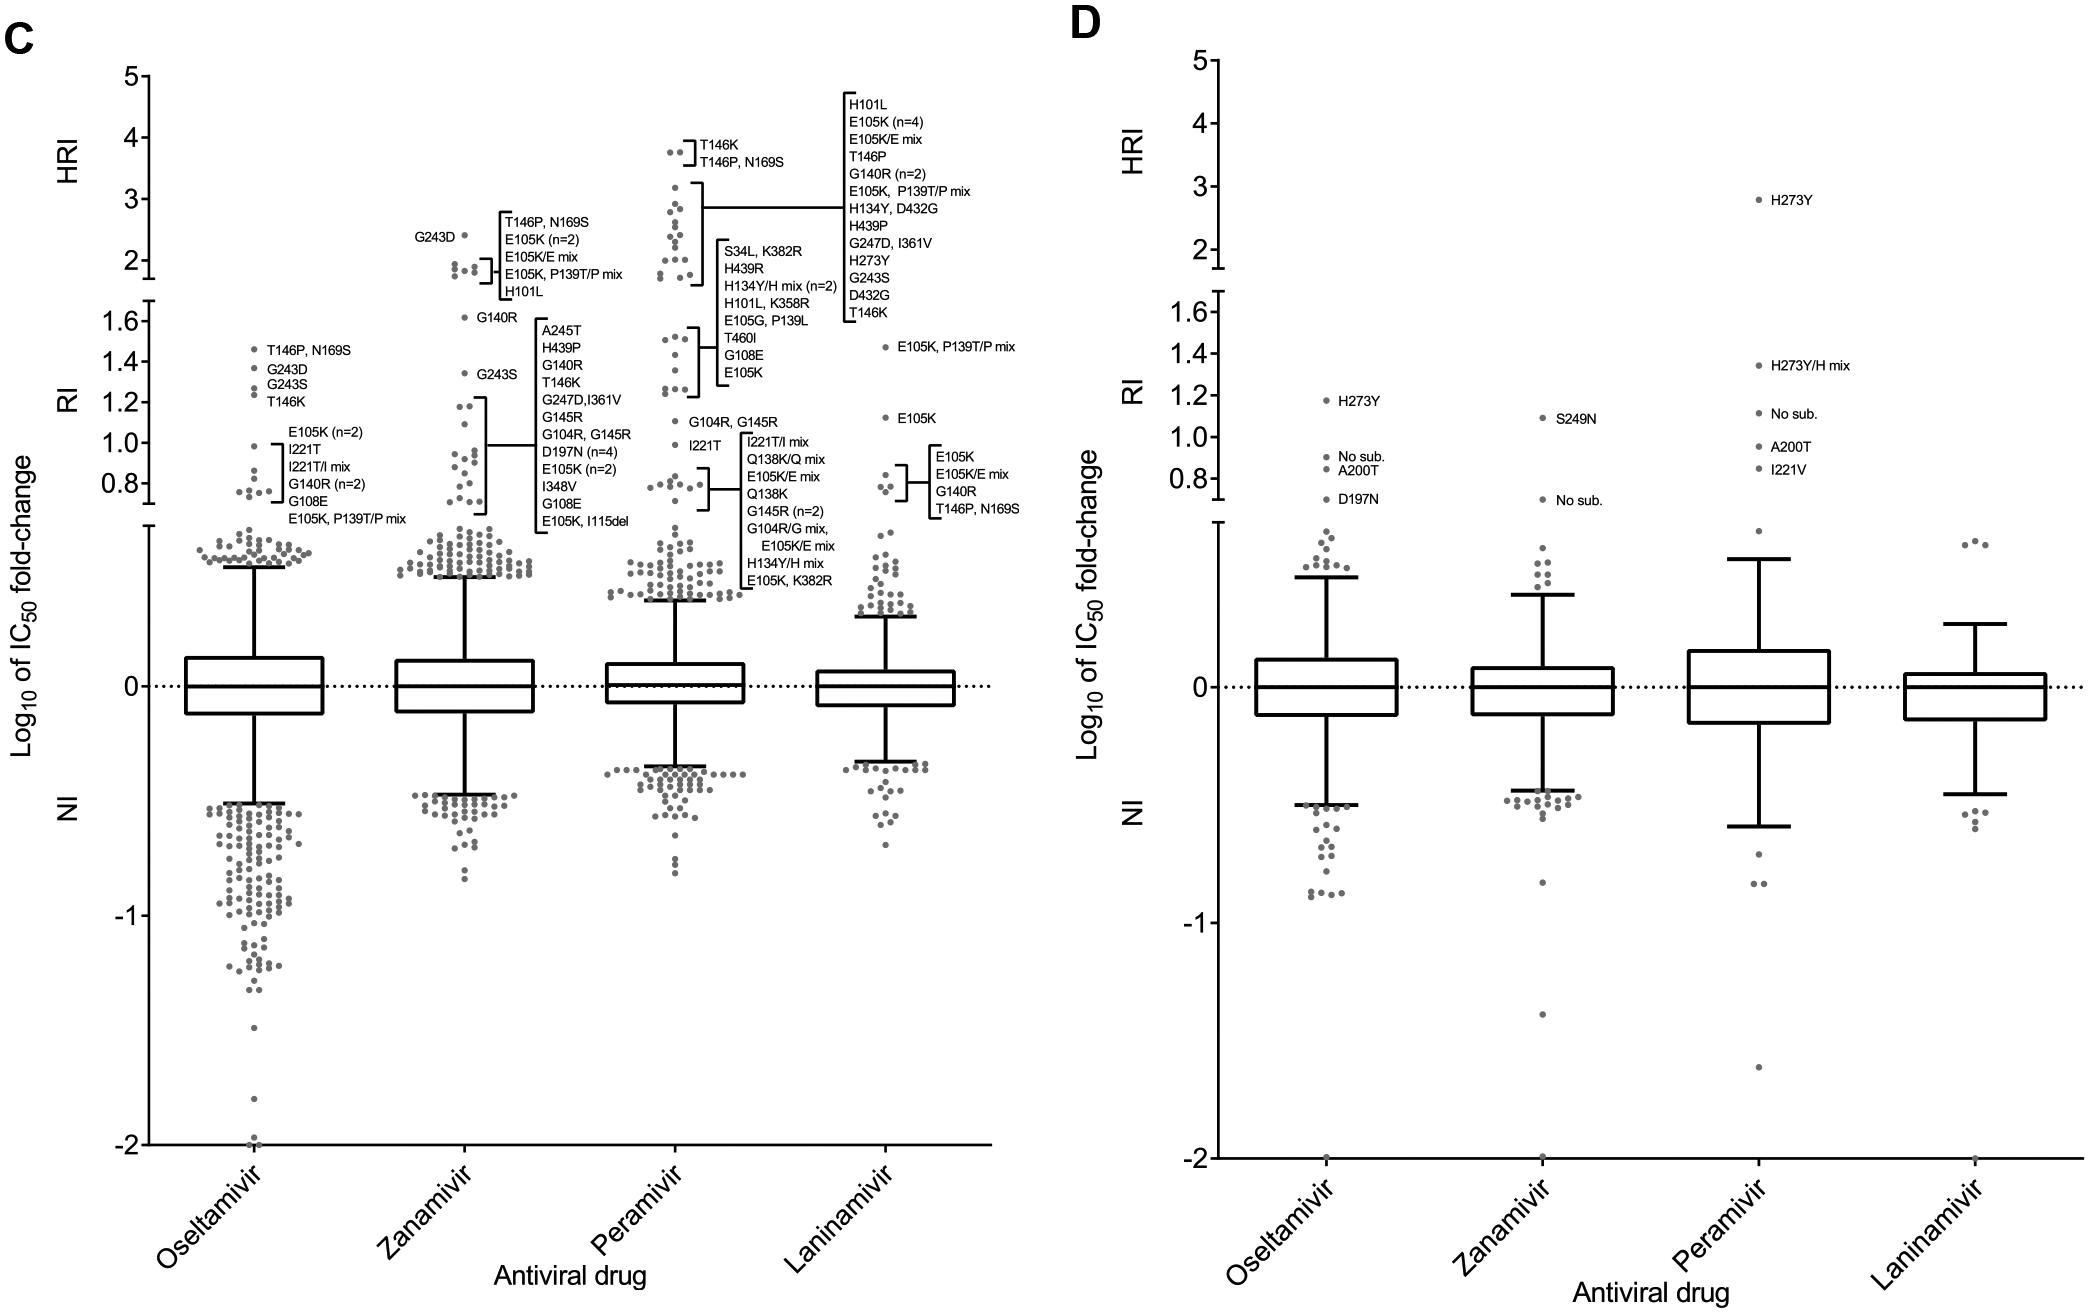
Column-scatter plots of log-transformed 50% inhibitory concentration (IC50) fold-change values for NAIs. Overall, 13536/19966 and 9853/15582 viruses were tested phenotypically for 2018–2019 and 2019–2020, respectively. Data are presented by virus subtype or lineage [(A) A(H1N1)pdm09; (B) A(H3N2); (C) B/Victoria-lineage; and (D) B/Yamagata-lineage] and NAI (labelled on the x-axis: oseltamivir, zanamivir, peramivir and laninamivir). The boxes indicate the 25th–75th percentiles, and the whiskers stretch to the lowest and highest values within 1.5 times the interquartile region (IQR) value from both the 25th and 75th percentile values, respectively (Tukey’s definition). The y-axes have been split into three compartments according to the thresholds recommended by the World Health Organization Expert Working Group of GISRS for normal inhibition (NI) (<10-fold for type A viruses; <5-fold for type B viruses), reduced inhibition (RI) (10- to 100-fold for type A viruses; 5- to 50-fold for type B viruses), and highly reduced inhibition (HRI) (>100-fold for type A viruses; >50-fold for type B viruses). NA amino acid substitutions are shown for viruses displaying RI or HRI phenotypes that have been sequenced. Viruses showing NI but carrying amino acid substitutions previously associated with RI or HRI by one or more NAI or showing an RI or HRI phenotype for another NAI are indicated in grey in the NI area above 1.5 times the IQR from the 75th percentile border and below the RI threshold value. Full details about these viruses are given in Tables S3 and S4. Amino acid position numbering is specific to A subtype and B type. Most viruses were tested for susceptibility to oseltamivir and zanamivir; only a subset was tested for susceptibility to peramivir and laninamivir.