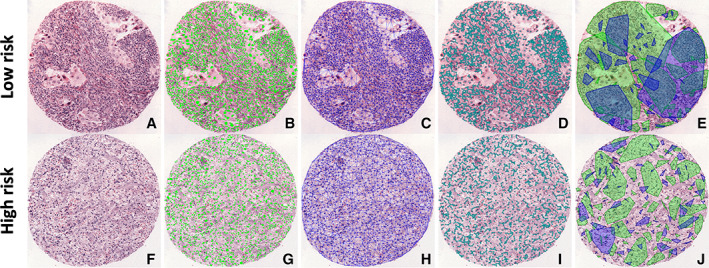
Figure 3.

Illustration of the use of hand‐crafted features for risk stratification of lung cancer. Tissue microarray from low‐risk and high‐risk lung cancer patients showing: (A, F) digitized H&E images; (B, G) features with automated nuclei detection; (C, H) features with Delaunay triangulation – a type of global graph; (D, I) local graph based on the distance between closest nuclei; and (E, J) feature showing the spatial architecture of tumor‐infiltrating lymphocytes with lymphocytes (blue) and non‐lymphocytes (green). Clusters are built based on distance thresholds. If cells of the same type are closer than a threshold, they form a cluster.
